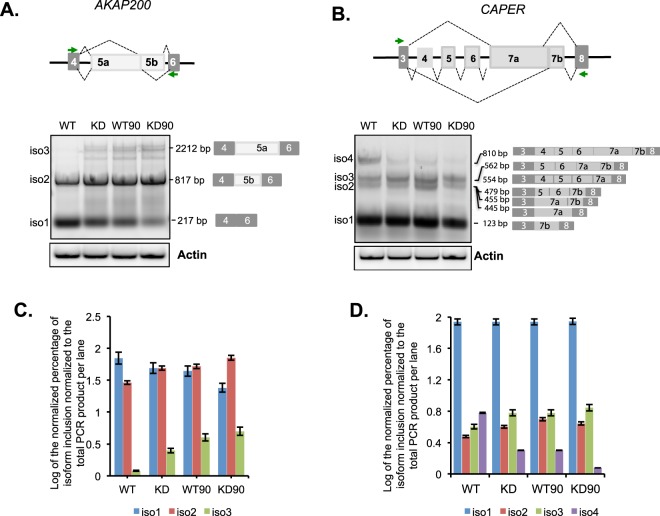
Figure 5.
PARP1-mediated coupling of RNAPII elongation and splicing kinetics is impaired in PARPI depletion. PCR products with exon junction spanning primers validate splicing changes in AKAP200 (A) and CAPER (B). Agarose gel images show the difference in splicing products between wildtype-non-treated (WT) and PARP1 knockdown (KD) cells before DRB treatment and at 90 min post-DRB recovery time point (WT90 and KD90 respectively). Actin was used as a PARP1-non-target control. The intensity of all bands per lane was quantified and the total band quantification was set to 100%. The relative amount of each band per lane was calculated as a percentage of the total band intensities per lane. The log values of the relative amount of each band to the total PCR product per lane for AKAP (C) and CAPER (D). Log values were plotted for easier visualization of the differences.

