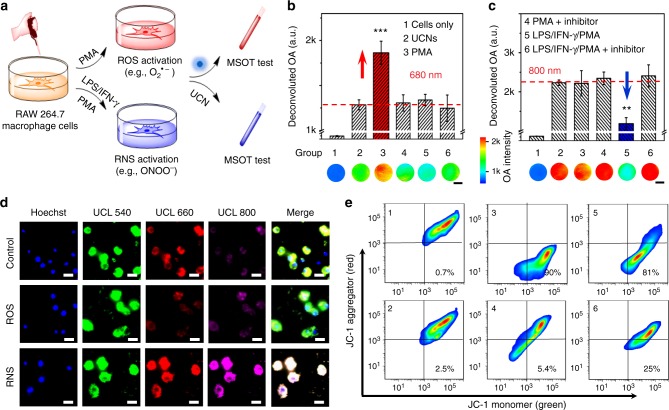
Fig. 3.
Inflammatory response of endogenous redox species by upconversion nanocrystals (UCNs) in live cells. a Scheme of endogenous reactive oxygen and nitrogen species (ROS/RNS) stimulation and inflammation profiling through UCNs in RAW264.7 macrophage cells. b, c Deconvoluted optoacoustic (OA) signals at 680 nm (b) and 800 nm (c) of macrophage cells in different groups: (1) cells only; (2) cells incubate with UCNs; (3) phorbol 12-myristate 13-acetate (PMA)-stimulated cells (O2•− generation) with UCNs; (4) PMA-stimulated cells with O2•− inhibitor (Mn(III) tetrakis (4-benzoic acid) porphyrin (MnTBAP)) and UCNs; (5) lipopolysaccharide (LPS/interferon-γ (INF-γ)/PMA-stimulated cells (ONOO− generation) with UCNs; (6) LPS/INF-γ/PMA-stimulated cells with ONOO− inhibitor (mercaptoethyl guanidine (MEG)) and UCNs. Scale bar: 1 mm. **p < 0.01, ***p < 0.001. Data were represented as mean ± SD. d Upconverted luminescence (UCL) fluorescence imaging of RAW264.7 cells incubated with UCNs (100 μg mL−1) in the absence (top), in the presence of O2•− (middle), and ONOO− (bottom) generation. Blue: Hoechst 33342 (Ex: 405 nm, Em: 460/50 nm), green: UCL-540 (Ex: 980 nm, Em: 540/50 nm), red: UCL-660 (Ex: 980 nm, Em: 640/50 nm), violet: UCL-800 (Ex: 980 nm, Em: 790/30 nm). Scale bar: 20 μm. e Flow cytometry (FCM) analysis of mitochondrial membrane potential (Δψm) by JC-1 in macrophage cells at different groups. Green channel (monomer): Ex: 488 nm, Em: 530/50 nm. Red channel (aggregator): Ex: 561 nm, Em: 610/75 nm

