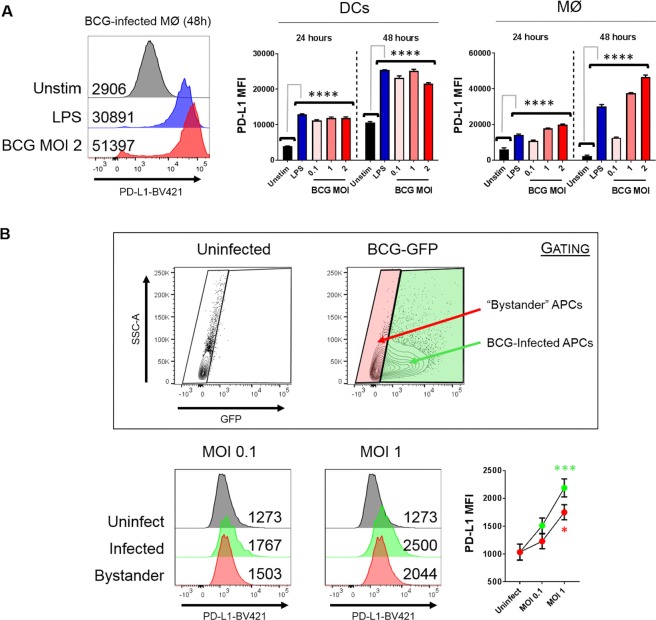
Figure 2.
BCG can up-regulate PD-L1 expression without direct cellular association. DCs and macrophages were infected in duplicate with BCG and PD-L1 expression was assessed by flow cytometry. (A) Left: Representative staining of PD-L1 on macrophages at 48 hours. Cells were gated by size and then viability. Numbers denote median fluorescence intensity (MFI). Right: PD-L1 expression on DCs and macrophages infected with 0.1–2 MOI BCG or stimulated with 100 ng/mL LPS, at 24 h and 48 h post-infection. (B) Macrophages were infected with BCG expressing GFP for 24 h. Top: Gates were set on the negative control to determine GFPneg and GFPpos populations. Bottom left: Representative histograms depicting PD-L1 expression in GFPneg and GFPpos cells. Bottom right: Pooled data showing PD-L1 MFI in infected and bystander macrophages. Significance was tested against the negative control by two-way ANOVA with Dunnett’s post-test (A,B). Bars depict means ± SEM. Data derived from n = 3 experiments: ****p < 0.0001. *p < 0.05.

