Figure 2.
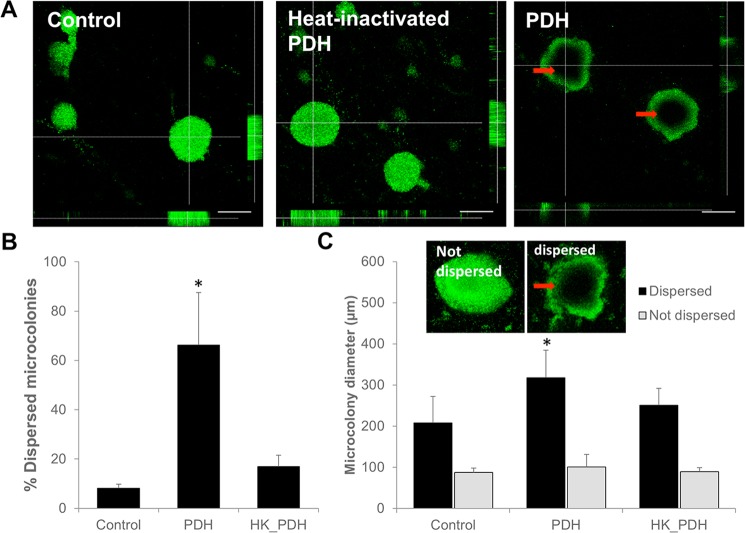
Pyruvate depletion coincides with P. aeruginosa biofilms showing signs of dispersion. (A) Representative confocal images of biofilms grown for 4 days in 24-well polystyrene plates that were left untreated (control), or were exposed to 10 mU PDH or 10 mU heat-inactivated PDH (HK_PDH). Red arrow indicates central hollowing of microcolony architecture. White size bar = 100 µm. (B) Number of microcolonies as percent of the total colonies counted per treatment group, showing void formation indicative of dispersion. (C) Average diameter of microcolonies that appeared to be dispersed or not dispersed. Inset, representative images of microcolonies that were considered in the analysis as “not dispersed” or “dispersed”. Error bars represent standard deviation of biological replicates. *Statistically different (p < 0.05) from untreated biofilms.

