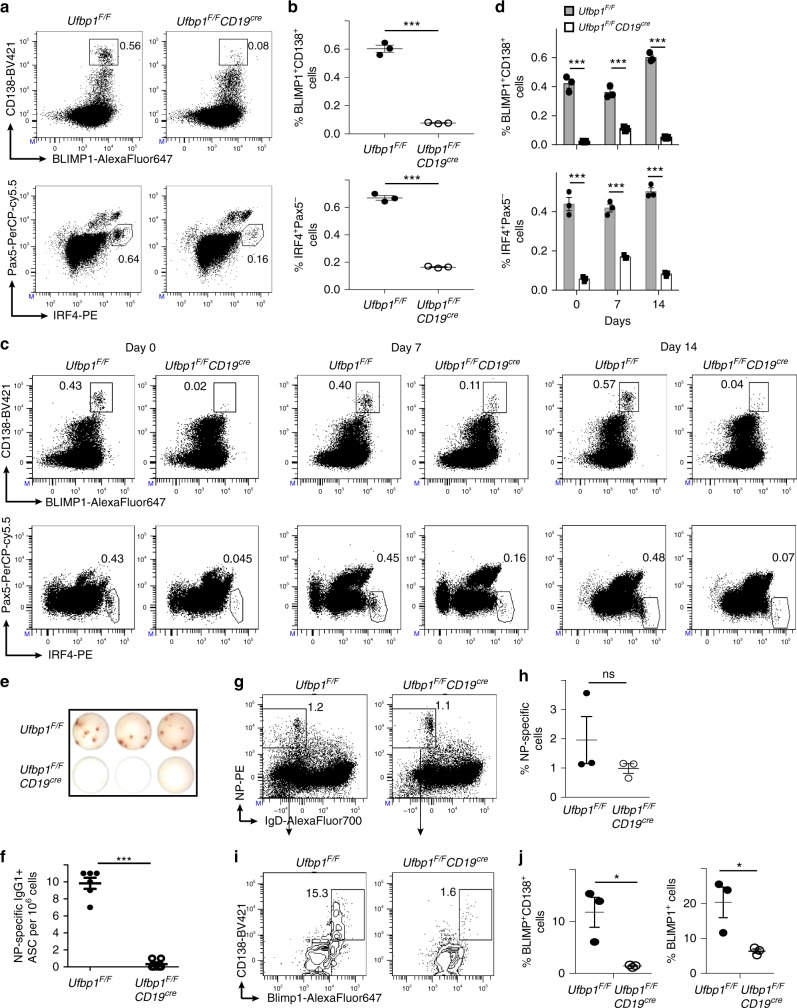
Fig. 2.
Decreased number of plasma cells in Ufbp1F/FCD19cre mice. a Bone marrow cells from indicated mice were stained with BLIMP1, CD138, IRF4, and Pax5, and analyzed by flow cytometry. Shown is the BLIMP1 versus CD138 (upper panel), and IRF4 versus Pax5 staining (lower panel) b Enumeration of frequencies of BLIMP1+CD138+ and IRF4+Pax5− cells in a (n = 3 mice/genotype). c Ufbp1F/F and Ufbp1F/FCD19cre mice immunized with 4-hydroxy-3-nitrophenylacetyl conjugated to keyhole limpet hemocyanin (NP-KLH) as in Fig. 1c were analyzed for plasma cells (BLIMP1+CD138+ and IRF4+Pax5−) in bone marrow by flow cytometry at the indicated time points after immunization. d Enumeration of the frequencies of plasma cells (BLIMP1+CD138+ and IRF4+Pax5−) in c (n = 3 mice/genotype). e Indicated mice were immunized as in Fig. 1c. Twenty-one days later, bone marrow cells were analyzed for the presence of NP-specific IgG1+ASCs by ELISpot. Shown is a photograph of representative ELISpot wells. f Number (mean ± SEM) of NP-specific IgG1+ ELISpots in e (n = 6 mice/genotype). g Ufbp1F/F and Ufbp1F/FCD19cre mice were immunized with NP-KLH in Sigma Adjuvant System and on day 10, 7-AAD−CD4−CD8−Gr-1−CD11b− splenic cells were analyzed for IgD and NP staining by flow cytometry. h Enumeration of the frequency of IgD−NP+ cells in g (n = 3 mice/genotype). i BLIMP1 and CD138 expression by IgD−NP+ cells in g was analyzed by flow cytometry. j Enumeration of frequency of BLIMP1+CD138high (left panel) and BLIMP1+ (right panel) cells among IgD-NP+ cells in i (n = 3 mice/genotype). Numbers represent the percent positive cells in the adjacent gated area. Error bars represent mean ± standard error. *P < 0.05, ***P < 0.001, ns nonsignificant. Unpaired Student’s two-tailed t-test was used. A representative of at least two experiments is shown

