Fig. 7.
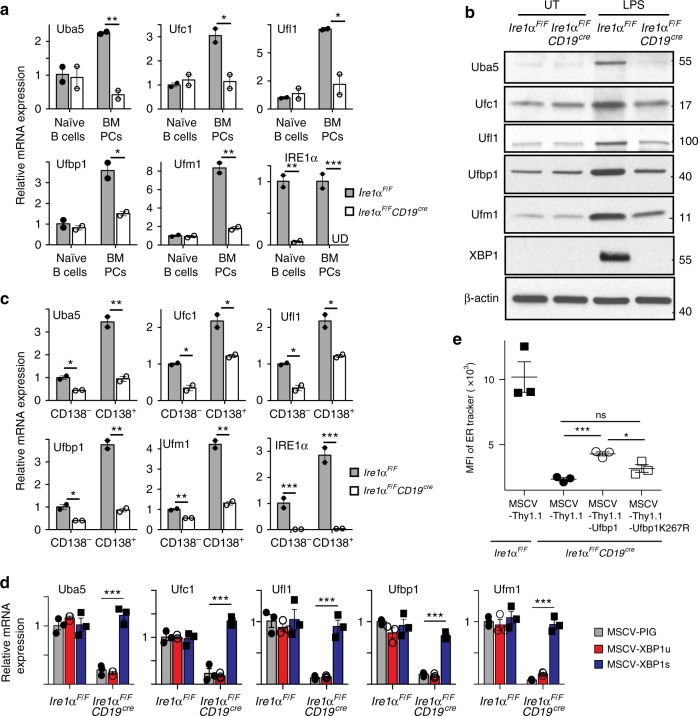
Ufbp1 downstream to IRE1/XBP1 induces endoplasmice reticulum (ER) expansion. a Naive B cells and plasma cells were sorted from the spleens and bone marrows respectively of Ire1αF/F and Ire1αF/FCD19cre mice. Expression of the indicated molecules normalized against β-actin was quantified by quantitative real-time PCR (qRT-PCR). b Total cell lysates from naive B cells (untreated) and treated with lipopolysaccharide (LPS) for 3 days from indicated mice were immunoblotted with antibodies against indicated molecules. c Naive B cells from Ire1αF/F and Ire1αF/FCD19cre mice were treated with LPS. Three days later cells were sorted into CD138− and CD138+ populations. Expression of Uba5, Ufc1, Ufl1, Ufbp1, Ufm1, and IRE1α mRNA normalized against β-actin was quantified by qRT-PCR. d Naive B cells from Ire1αF/F and Ire1αF/FCD19cre mice were stimulated with LPS and transduced with retroviruses expressing empty vector (MSCV-PIG), unspliced XBP1 (MSCV-XBP1u), or spliced XBP1 (MSCV-XBP1s) on day 2. On day 4, CD138+ cells transduced with viruses were sorted and expression of Uba5, Ufc1, Ufl1, Ufbp1, and Ufm1 mRNA normalized against β-actin was quantified by qRT-PCR. Error bars represent standard error of mean. e LPS-stimulated B cells from wild-type and Ire1αF/FCD19cre mice were transduced with empty retrovirus (MSCV-Thy1.1), retrovirus expressing Ufbp1 or Ufbp1K267R. Cells were stained with anti-Thy1.1, CD138, and ER-tracker dye, and analyzed by flow cytometry. Shown is the mean fluorescent intensity (MFI) of the ER-tracker staining on the CD138+ cells among cells transduced with retrovirus (Thy1.1+ cells). Error bars represent mean ± standard error. *P < 0.05, **P < 0.01, ***P < 0.001, ns nonsignificant. Unpaired Student’s two-tailed t-test was used. A representative of at least two experiments is shown

