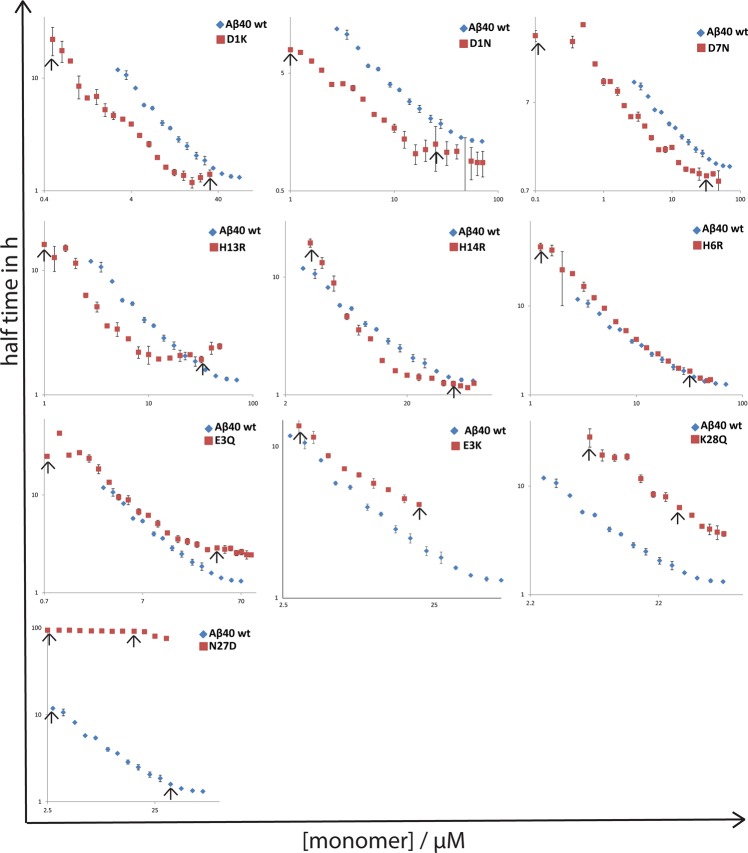
Figure 6.
Comparison of t1/2 of aggregation for different variants [Aβ40 wild-type, D1K, D1N, D7N, H13R, H14R, H6R, E3Q, E3K, K28Q and N27D] vs. concentration. Log-log plots of faster fibril forming mutants (D1K, D1N, H13R, H14R and D7N) lie below the Aβ40 wild-type curve while the slower fibril forming mutant (E3K, K28Q and N27D) show its curve above the wild-type. H6R and E3Q almost merge with the Aβ40 wild-type. Data points between the arrows represent the half time points of concentrations 32 µM (E3K – 20 µM) to lowest possible. D23N is not included as we have half times available only for three different concentrations.

