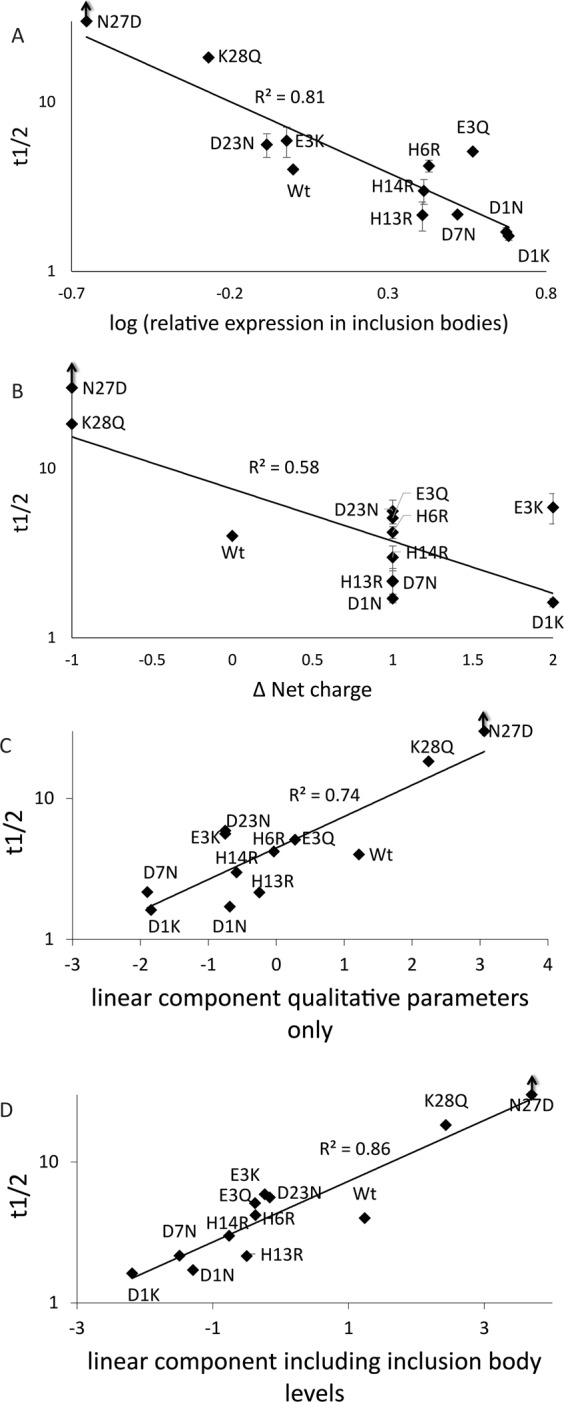
Figure 8.

Plots showing the trends of: (A) half time vs relative expression of various Aβ mutant peptides in inclusion bodies (B) half time vs net charge of various Aβ mutant peptides, (C) half time vs linear principal component score based on all quantitative parameters, except inclusion body levels (D) half time vs linear principal component score based on all quantitative parameters including inclusion body levels. Note that logarithm y-axis is used and for x-axis log values of relative expression in inclusion bodies are used.
