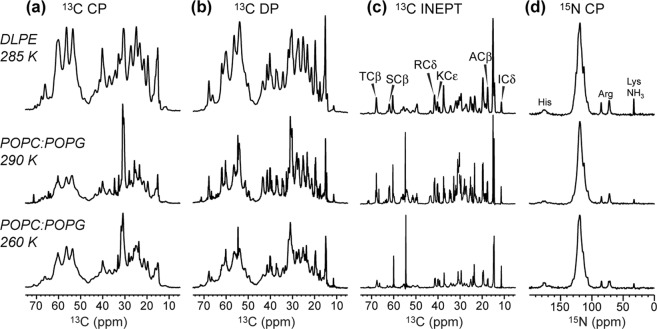
Figure 3.
1D 13C and 15N NMR spectra of BM2 in DLPE and POPC: POPG (4:1) bilayers at different temperatures. (a) 13C CP spectra, which selectively detect immobilized residues. (b) 13C DP spectra, which detect all residues’ signals. (c) 13C INEPT spectra, which selectively detect the signals of highly dynamic residues. (d) 15N CP spectra of immobilized residues. Top row shows the DLPE spectra measured at 285 K. Middle row shows the POPC: POPG spectra measured at 290 K. Bottom row shows the 260 K spectra of the POPC: POPG sample. Signals from the N-terminal solubility tag are predominantly seen in the INEPT spectra, whereas the TM signals dominate the CP spectra.

