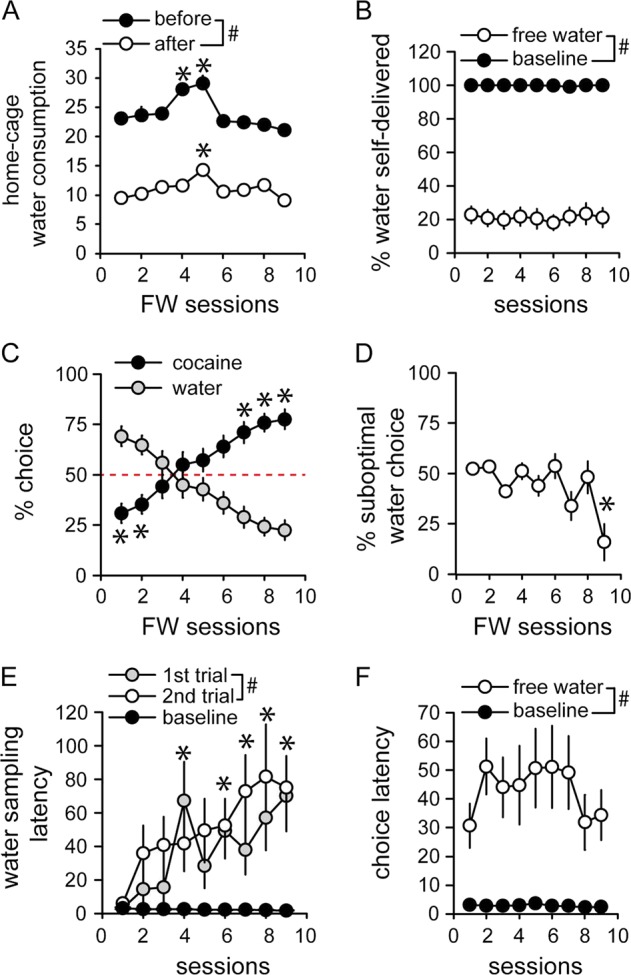
Fig. 3. Slow reversal of preference during devaluation training.

a Mean water consumption in mL (±SEM) during home-cage water accesses before (black circles) and after (white circles) Free Water (FW) sessions. #Difference between before and after (p < 0.0001). *Different from the first FW session (p < 0.001). b Percent of volume self-delivered (±SEM) across deprivation (baseline) and FW sessions. #Difference between baseline and FW sessions (p < 0.0001). c Mean percent of cocaine and water choices (±SEM) as a function of FW sessions. The horizontal dashed line at 50% represents the indifference level. *Different from the indifference level (p < 0.05, t-test). d Mean percent of suboptimal water choices not followed by consumption (±SEM), as a function of FW sessions. *Different from first FW session (p < 0.01). e Mean water sampling latency (±SEM) in the first and second trials of FW sessions (gray and white circles) and during baseline sessions (black circles). #Difference between 1st and 2nd sampling trials of FW sessions (p < 0.05). *Different from baseline sessions (p < 0.05). f Mean choice latency (±SEM) across FW and baseline sessions. #Difference between Free Water and baseline sessions (p < 0.0001)
