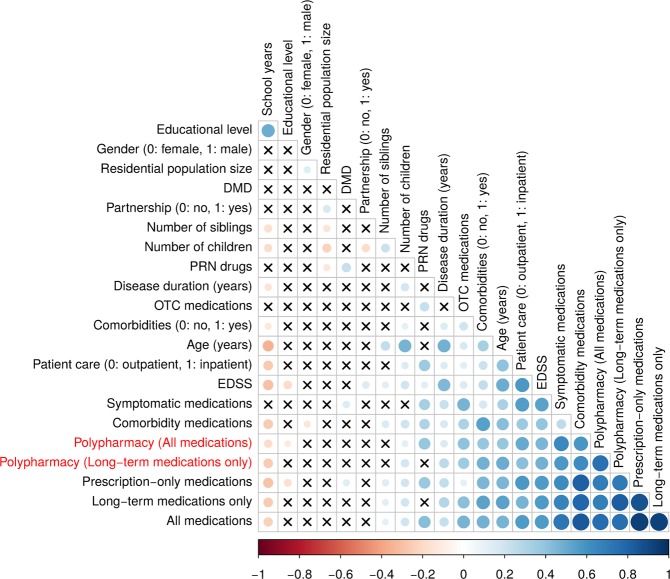
Figure 4.
Correlation matrix visualization of the correlation between variables and polypharmacy status. Using the “corrplot” R package, the correlation matrix heatmap was built. The degree of pairwise correlation with respect to Pearson’s correlation coefficient is displayed by the colour gradient. The crosses represent absence of significance (p-values > 0.05). A significant correlation was seen, for instance, between age and comorbidities. DMD, disease-modifying drug; EDSS, expanded disability status scale; OTC, over-the-counter; PRN, pro re nata.

