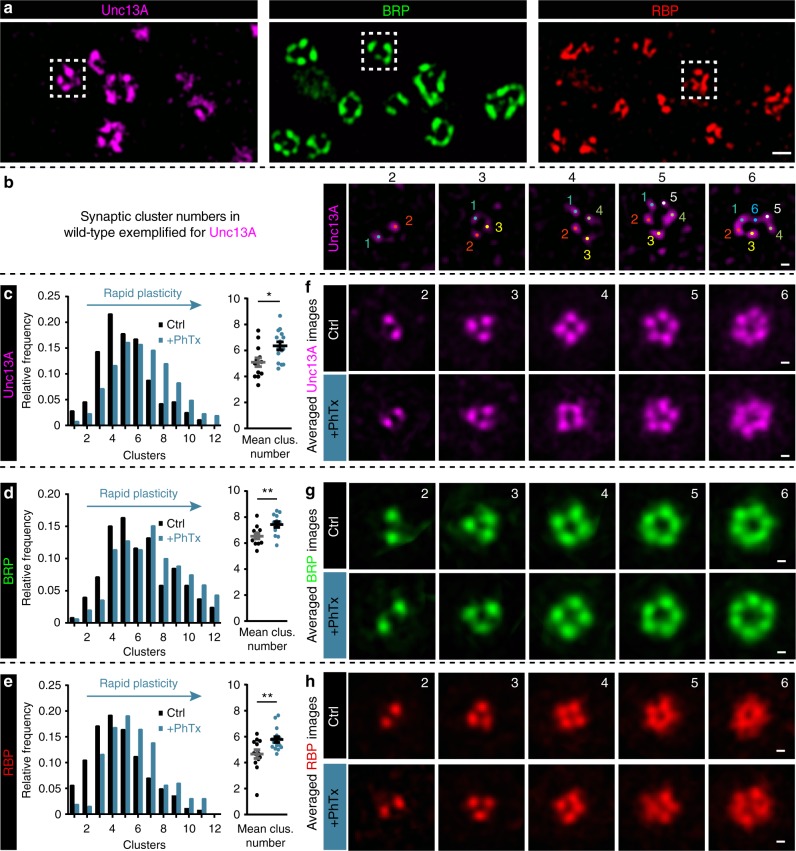
Fig. 2.
Rapid plasticity alters Unc13A/BRP/RBP AZ protein cluster number. a STED microscopy images containing several AZs with variable numbers of protein clusters of Unc13A (magenta), BRP (green) and RBP (red). Dashed white boxes mark one AZ example used for the cluster number counting. b Example AZs with 2–6 Unc13A clusters, marked by colored dots and used for cluster number counting. (c–e, left) Frequency distribution of Unc13A (c), BRP (d), and RBP (e) modules per AZ either without (Ctrl, −PhTx; black) or with PhTx (+PhTx; blue) treatment. f–h Average of rotated STED images stained against Unc13A (f), BRP (g), and RBP (h) with 2–6 modules either without (Ctrl) or with PhTx (+PhTx) treatment. See also Supplementary Figs. 2–4. Source data as exact values, detailed statistics including sample sizes and P values are provided in the Source Data file. Scale bars: a 200 nm; (b, f–h) 50 nm. Statistics: Mann-Whitney U test. *P ≤ 0.05; **P ≤ 0.01. Panels (c–e) show NMJ-wise means of AZ-mean ± s.e.m.

