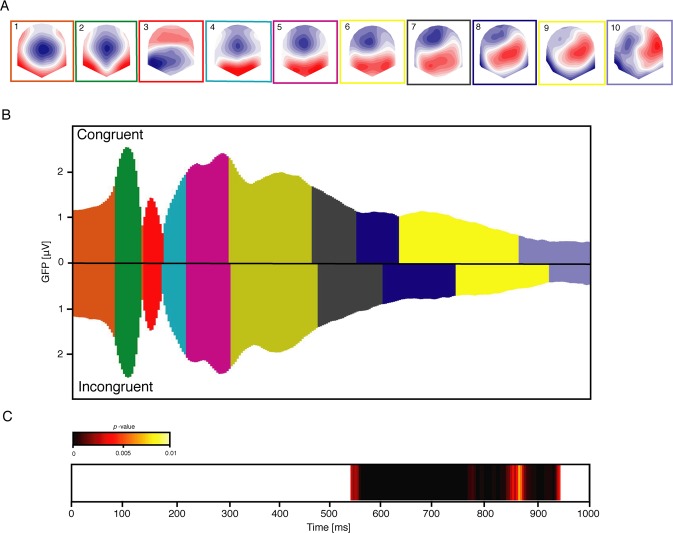
Figure 1.
Microstate analysis and TANOVA results outlining periods of topographic differences of the grand mean ERPs of congruent and incongruent conditions. (A) Topographies of the ten microstate maps obtained from the cross-validation procedure. The microstate maps are labelled from 1 to 10 and displayed in sequence of occurrence from left to right. Red and blue indicate positive and negative potential values, respectively; all maps have been scaled to have GFP = 1. The colored frame surrounding each microstate map indicates the assignment shown in B. (B) The assignment of the ten microstate maps to the grand mean data of the congruent (upper) and incongruent (lower) condition as function of time (horizontal axis) and GFP (vertical axis). The colors of the areas refer to the colored frames surrounding each microstate maps shown in A. (C) The color-coded p-values of the TANOVA plotted for each time point. The white temporal windows reflect non-significant topographic differences, while the yellow-to-back window highlights significantly differing topographies (p < 0.01).

