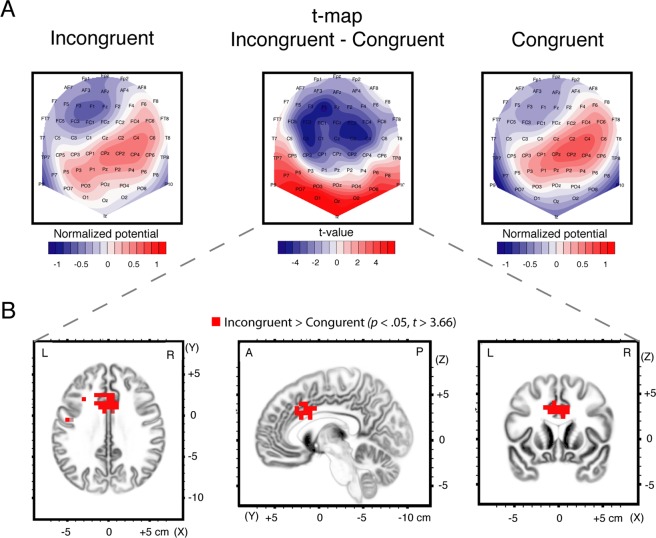
Figure 2.
t-map and sLORETA contrasts between congruent and incongruent conditions computed in the time period between 538 and 742 ms. (A) Mean ERP mean topographies computed for the congruent (left) and incongruent (right) conditions. Topographies were normalized (GFP = 1). Red and blue indicate positive and negative potential values, respectively. Also shown in the middle is a standard t-map contrasting incongruent and congruent topographies in the same time period. Positive (red) and negative (blue) t-values indicate more positive and more negative potential in the incongruent condition compared to the congruent condition, respectively. (B) Voxel-wise t values comparing the sLORETA source density between the incongruent and congruent condition. Cluster of voxels located in the anterior cingulate cortex (BA 24 and 33) and cingulate gyrus (BA 24 and 32) showed increased activation in the incongruent compared to the congruent condition. All voxels reaching the threshold for p < 0.05 (corrected for multiple comparison, t > 3.66) are color-coded in red.

