Fig. 3.
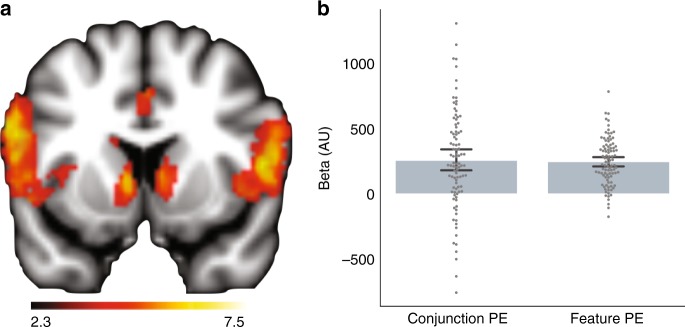
Striatal error response. a Regions responsive to PEs from the Feature RL model, whole-brain analysis; p < .05, t-test, FDR corrected. Color-scale refers to cluster-corrected z-values. b An ROI analysis of striatum showed that voxels with responses that scaled with PEs from the Feature RL model also scaled with PEs from the Conjunctive RL model. The feature PE bar is a statistically independent depiction of the striatal response in a. The conjunction PE bar shows that errors from a conjunctive learning system explained variance in striatal BOLD above and beyond errors from a feature learning system. Dots correspond to individual runs with the subject intercepts removed. Error bars depict bootstrapped estimates of the standard error of the group mean. Source data are provided as a Source Data file

