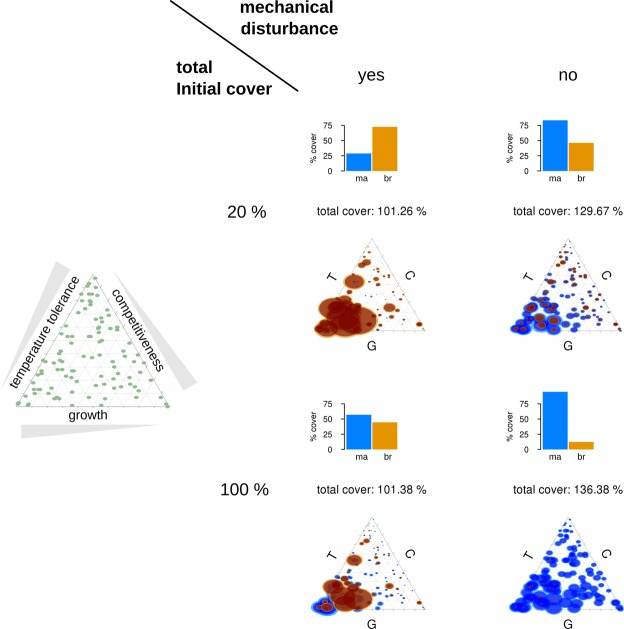
Figure 1.
Scenario 1: The coral community after 90 years of simulation time without extreme thermal events. The left-hand triangle shows show the initial coral community and the distribution of specific trait combinations (Temperature tolerance, Competitiveness, and Growth rates). Within the main plot, simulation results are shown with a total initial coral cover of 20% (upper charts) and 100% (lower charts), with (left) and without (right) the occurrence of mechanical disturbance events. The resulting percentage cover of massive (‘ma’, blue) and branching (‘br’, orange) coral species is represented with bar charts above the respective triangle plot. In the trait space a circle centre indicates the trait combination for a species and the circle size indicates the coverage (mean in dark ± SD in lighter colours) of this trait combination.

