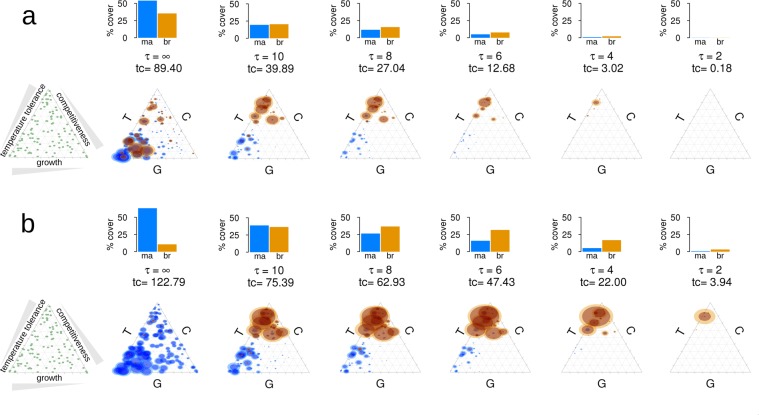
Figure 2.
Scenario 2: The surviving coral community after 90 years with respect to species trait combinations (a) with and (b) without the occurrence of mechanical disturbance events. The plots on the far left show the initial trait compositions. The plot second to the left shows the results when no extreme thermal events occurred during the simulation time (where the interval between bleaching events, τ, equals infinity). In the following plots the frequency of extreme thermal events increases from left to right (with values of τ decreasing from 10 to 2 years). Bar charts indicate the percentage cover of massive (‘ma’, blue) and branching (‘br’, orange) corals, and ‘tc’ indicates total coral cover. In the triangle plots below the bar charts the center of a circle indicates the specific trait combination and the size of the circle indicates the relative contribution of a species to the whole community’s covered area.

