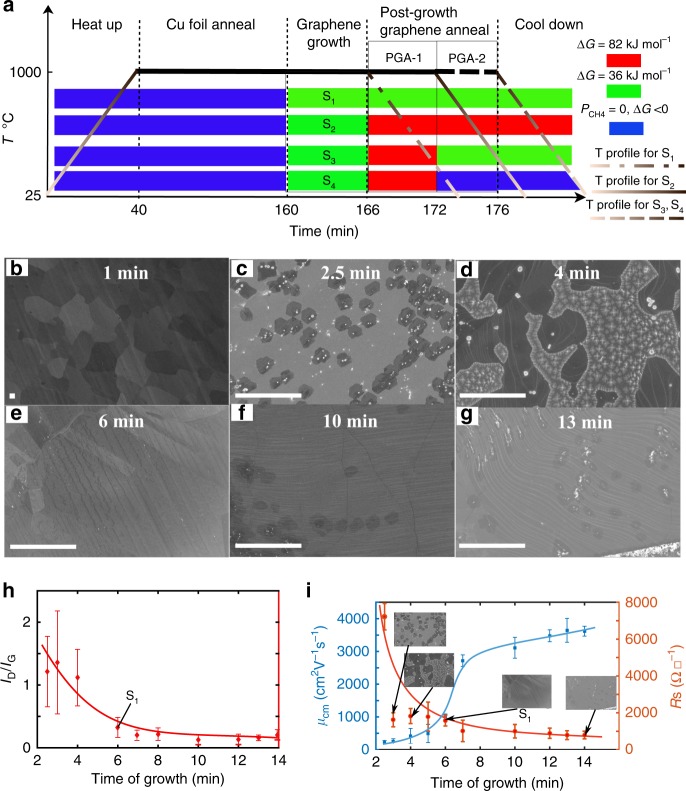
Fig. 1.
Growth and characteristics of the reference graphene group G1. a Graphene growth conducted in this work and the steps involved are described schematically. The growth atmosphere is color coded and the legend shows the supersaturation conditions. S1–S4 refer to four different samples as listed in Table 1. b–g SEM images of various stages of graphene growth on Cu under conditions used for the standard group G1. Growth time (from 160th minute in Fig. 1a) is indicated in the photographs. b Incubation period, t < 2 min, in which no nuclei are formed. c Nucleation stage, t = 2.5 min, in which domains of size ~ 2 µm are observed. d Growth stage, t = 4 min, in which individual domains grow by adatom addition until they merge with other similarly growing domains. e Visually coalesced graphene (VCG) observed after 6 min of growth. This sample is referred to as S1 and serves as a reference. f Surface image after 10 min of growth. g Surface image after 14 min of growth. The bright spots are Cu particles that are deposited from the vapor phase during cool down on exposed Cu areas. h The time evolution of film defect density as measured by Raman spectroscopy. i Charge mobility (μcm) and sheet resistance (Rs) evolution with growth time. While µcm shows a four-fold change after visual coalescence at 6 min, Raman defect density remains almost unchanged. A Gompertzian-Sigmoidal fit (blue continuous line in i) to the charge mobility is also shown. Scale bars in b–g: 10 µm

