Fig. 2.
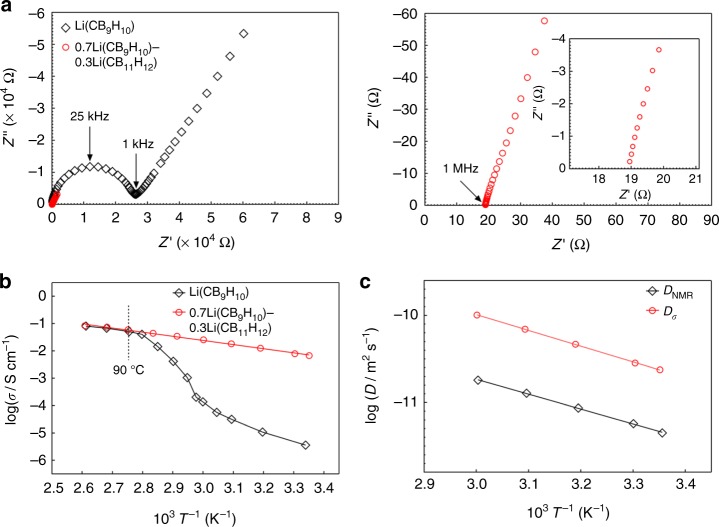
Lithium ion conductivity of 0.7Li(CB9H10)–0.3Li(CB11H12). a Nyquist plots of Li(CB9H10) and 0.7Li(CB9H10)–0.3Li(CB11H12) at 25 °C (left). Magnified Nyquist plots of 0.7Li(CB9H10)–0.3Li(CB11H12) in the high-frequency region (right). b Arrhenius plots of the lithium ion conductivities of Li(CB9H10) and 0.7Li(CB9H10)–0.3Li(CB11H12). c Arrhenius plots of the diffusion coefficients calculated from the impedance and NMR measurements

