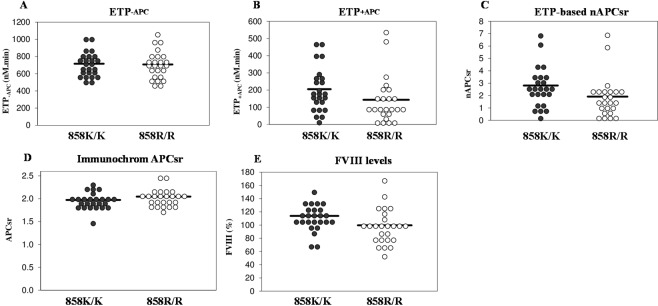
Figure 1.
Coagulation parameters in 858K/K and 858R/R homozygotes. Distributions of the ETP−APC (A), ETP+APC (B) and nAPCsr (C) measured with thrombin generation-based assay, the APCsr measured with the Immonochrom assay (D), and FVIII levels (E) in 25 homozygous carriers of rs4524 (858R/R) and in 25 non-carriers (858K/K). The horizontal lines represent the means of the distributions. Please note that APC resistance increases with increasing ETP-based nAPCsr and with decreasing Immunochrom APCsr.

