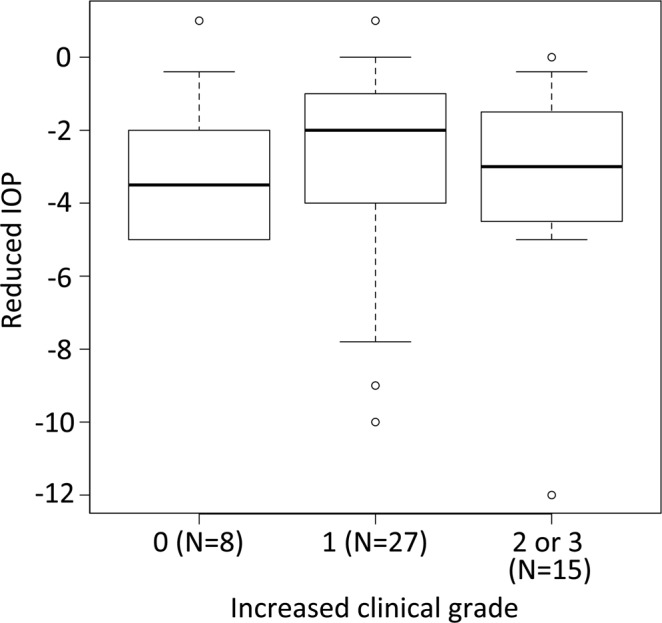
Figure 4.

The correlation between increased clinical grade and reduced IOP. This box-whisker plot depicts the correlation between increased clinical grade and reduced IOP (mmHg). The horizontal axis indicates clinical grade (the maximum clinical grade score observed post-instillation minus baseline clinical grade score), and the vertical axis represents the reduction of IOP (the minimum of IOP post-instillation) − (the IOP of baseline). For correlations between clinical grade and IOP, there was a non-significant trend P = 0.896 (Jonckheere-Terpstra Trend Test, two-tailed test). IOP values varied widely, and outliers at the top and bottom of the box-and-whisker plot are indicated by circles.
