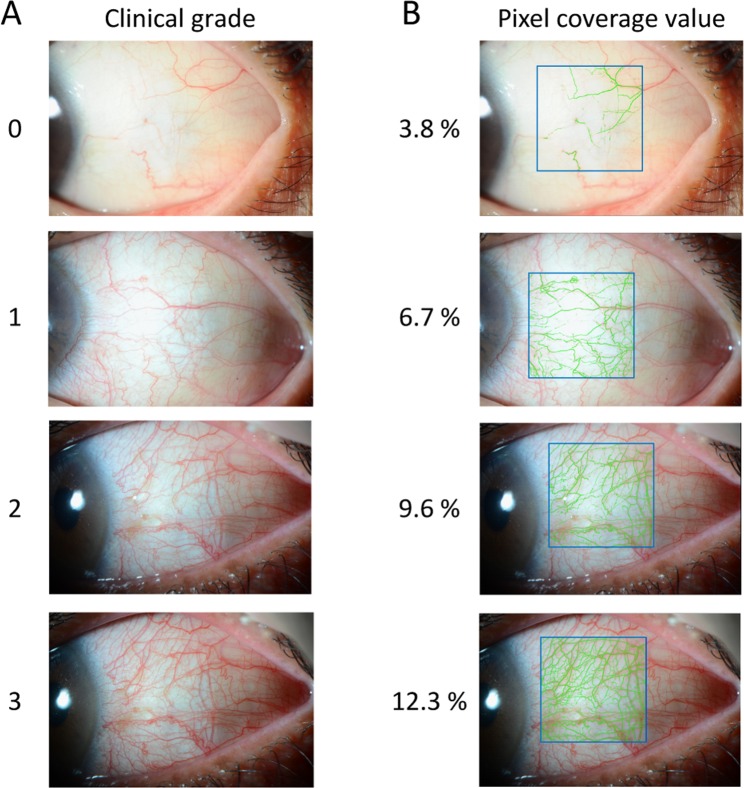
Figure 5.
Clinical grade and pixel coverage value of conjunctival hyperemia. Typical photograph of each clinical grade is shown (A). The software calculates the proportion of the conjunctival blood vessels as the pixel coverage. The pixel coverage value was automatically calculated for the closed square area (vertical 60% and horizontal 40%). When processing the photographs shown in (A) to the analysis software, blood vessels are drawn in the green area (B).

