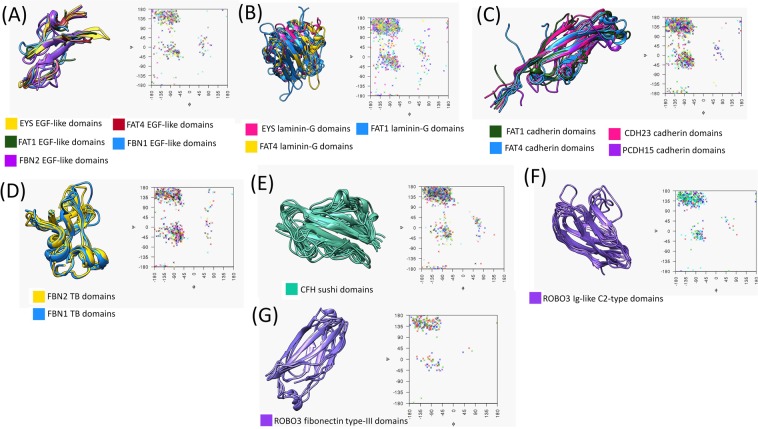
Figure 2.
Quality of domain structures. Panels A through F correspond to the EGF-like, laminin-G, cadherin, TB, sushi, Ig-like C2-type, and fibronectin type-III domains, respectively. The column on the left contains structurally superimposed domains shown by ribbon structures. Similar structures within each domain type are distinguished by protein color. The axes on the right of each panel contain the Ramachandran plots for each domain set, with arbitrary colors representing different domain models. For the EGF-like (A) and cadherin (C) domains, only 15 structures were selected to show in the Ramachandran plot. All domain structures of laminin-G (B), TB (D), sushi (E), Ig-like C2-type (F) and fibronectin type-III (G) were superimposed.

