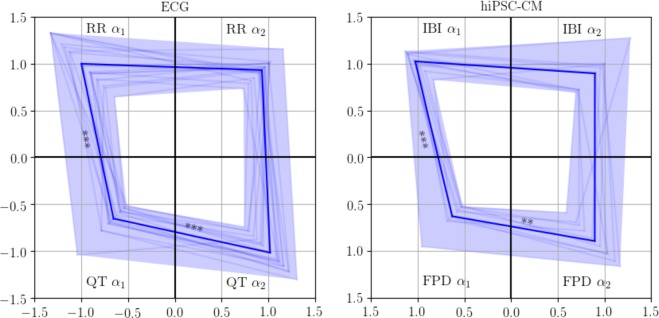
Figure 3.
Visualisation of the DFA α1 in the time scale of beats <20 and α2 in the scale of beats >30 for ECGs (left panel, N = 18) and hiPSC-CM aggregates (right panel, N = 10), respectively. Each corner of the quadrilateral corresponds to an α value. The mean value is marked with bold line, and the statistical significance of the difference in the α values are denoted with asterisks with following significance level: *p < 0.05, **p < 0.01, and ***p < 0.001.

