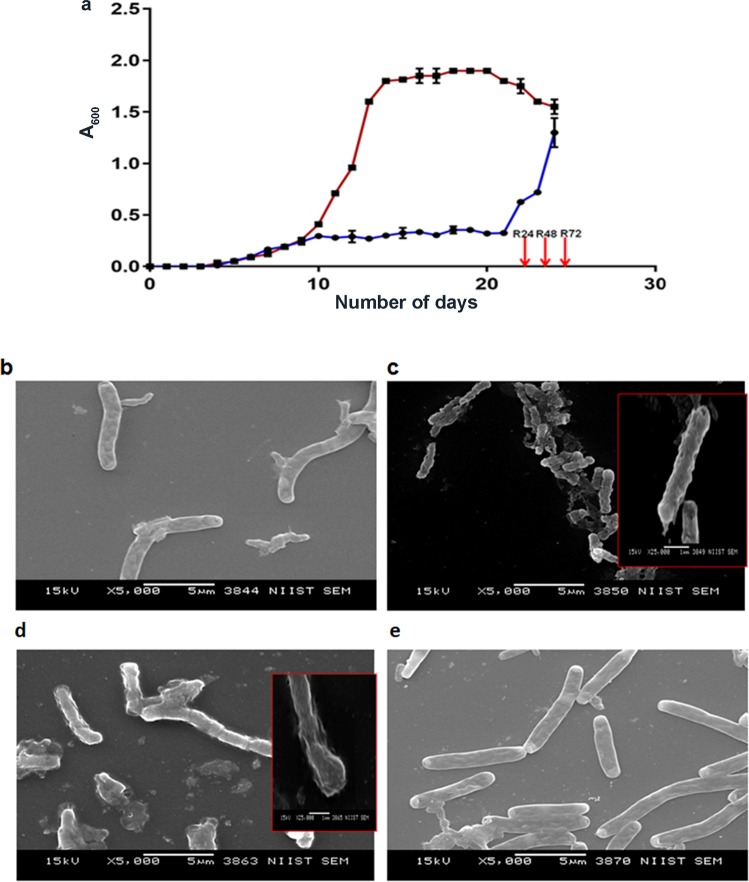
Figure 1.
In vitro dormancy and reactivation of MTB. Growth of MTB H37Rv subjected to hypoxia and re-aeration (a). Brown line indicates OD (A600 nm) of normoxially grown MTB H37Rv. Purple line indicates MTB grown under hypoxic condition and reactivation. Arrows indicate time points of re-aeration. The error bars indicate standard deviations of the mean optical densities (n = 2). Morphology of MTB subjected to dormancy and re-aeration (b–e). Scanning electron microscopic (SEM) images showing MTB from normoxia (log phase) (b), dormancy (c), R24 (d) and R144 (e) stages; Magnification-5000X for main images and 10000X for inlay images. Scale bars are 5 and 1 µm for 5000X and 10000X, respectively.

