Figure 3.
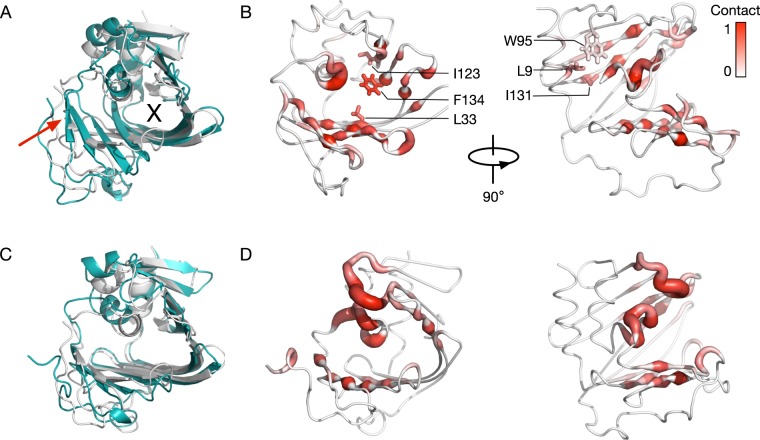
LolA binding site conforms to the shape of BLP lipid. (A) Structural comparison of LolA at the end of a simulation with zero MAC (cyan) to the crystal structure (grey). The tilt of the β-sheet is highlighted by the red arrow and the binding cavity is marked “X”. (B) Contact analysis with a distance cut-off of 4 A performed for each residue of LolA with BLP lipid averaged over three simulations. A score of 1 indicates contact made throughout the entire simulations. Residues that show more contact in simulations with zero MAC compared to that with three MACs are labelled. (C,D) Same analyses as (A,B), respectively, performed for simulations with 3 MACs.

