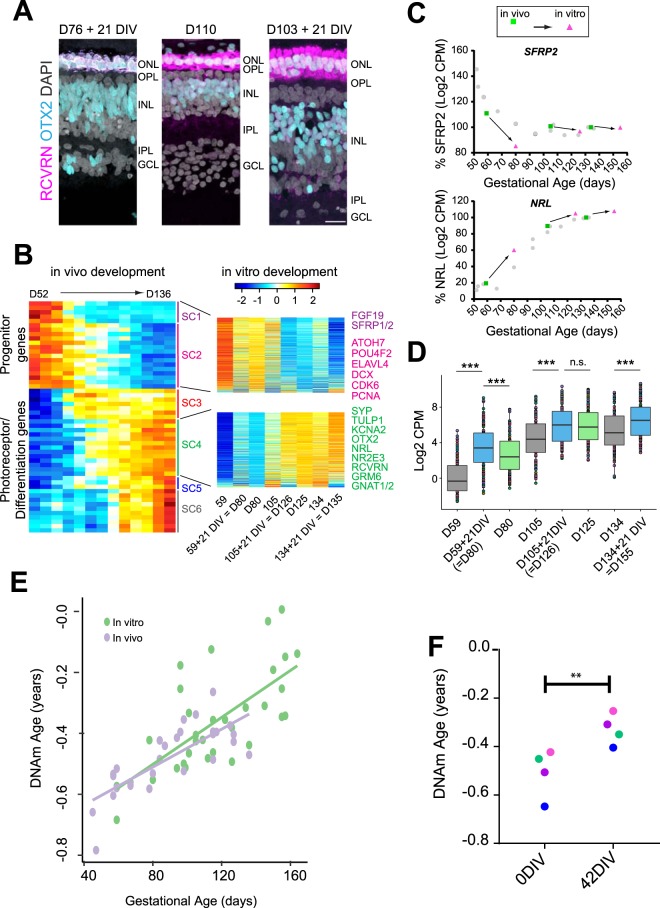
Figure 2.
(A) D76 and D103 retinal explants maintained for 21 DIV were compared to a D110 fetal retina processed acutely; immunostaining with OTX2 (cyan) and RCVRN (magenta) to label photoreceptors and bipolar cells and DAPI (white, all cells). (B) (Left) Heatmap of RNAseq data of human retinas from D52 to D136 (from Hoshino et al.27) showing all the Superclusters (SCs) of genes based on their developmental expression profiles. Heatmaps of SC1 and SC2 (top) and SC4 (bottom) gene expression of retinal pairs from D59, D105, and D134, with one retina taken for RNAseq immediately postmortem and the other after 21 days in vitro. (C) Plots for SFRP2 (a progenitor gene) and NRL (a rod photoreceptor gene) for each pair to show that the trends for the expression levels of these genes in vitro (pink symbols) is similar to that found in normal in vivo development (green symbols for paired retina, gray symbols for all other retinas). (D) Boxplot of expression level of the top highly expressed 100 genes from SC4 for the retinal pair data plotted in B, (p < 0.0001, two-sided paired t-test, NS = 0.9). (E) Retinas maintained in vitro for 42 days (blue) follow the same progression in epigenetic DNAm ages (y-axis) as those of uncultured retinas (gray dots). F. Retinal pairs (matched colors), one analyzed immediately post-mortem and the other after 42 days in vitro, show that the epigenetic DNAm age (y-axis) continues to progress in vitro (p-value <0.005, one-sided paired t-test).

