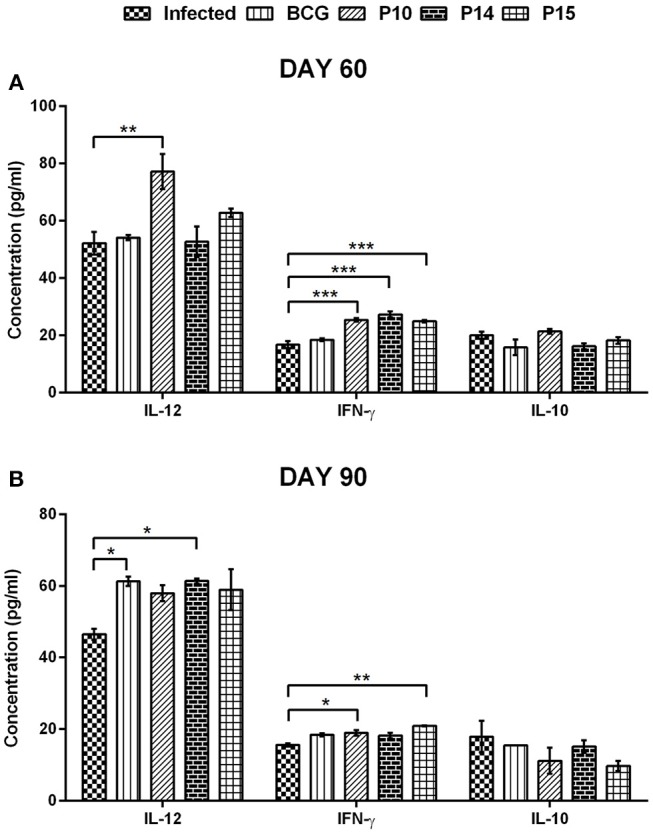
Figure 4.

Cytokines level in serum samples of vaccinated hamsters at day 60 (A) and day 90 (B) p.c. Significance values indicate the difference in cytokine concentration between infected and treated hamsters (*p < 0.05; **p < 0.01; and ***p < 0.001) and was calculated using One-way ANOVA.
