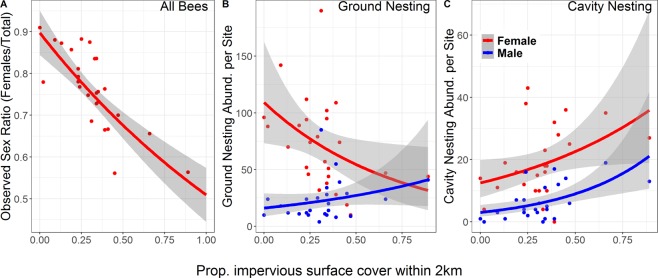
Figure 1.
Effects of urbanization on wild bee community. Relationship between the level of urban development (measured as proportional ISC within 2 km of the sampling site) and (A) bee observed sex ratio per site (OSR) (z = −4.73, d.f. = 23, p < 0.001); (B) ground-nesting bee abundance per site of females (red, t = −2.18, d.f. = 24, p = 0.04) and males (blue, t = 1.41, d.f. = 24,p = 0.17); and (C) cavity-nesting bee abundance per site of females (red, t = 1.98, d.f. = 24, p = 0.06) and males (blue, t = 3.36, d.f. = 24, p = 0.003). Fitted line in A represents GLM fit of female abundance offset by total abundance; in (B,C) lines represent GLM fit of female (red) or male (blue) abundance. Shaded regions represent standard error.

