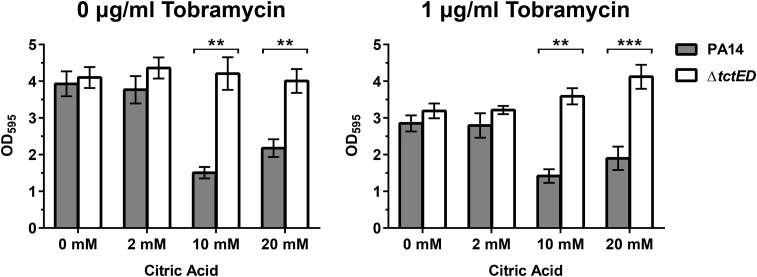
FIG 2.
Amount of biofilm formation compared between PA14 and the ΔtctED mutant in the presence of added citric acid. Conditions of no tobramycin and tobramycin at a subinhibitory concentration (1 μg/ml) were tested. The results represented by the columns represent the means from 3 biological replicates, and error bars are SEMs. The Bonferroni-Dunn method was used to determine significance. **, P < 0.01; ***, P < 0.001.

