
Figure 3.
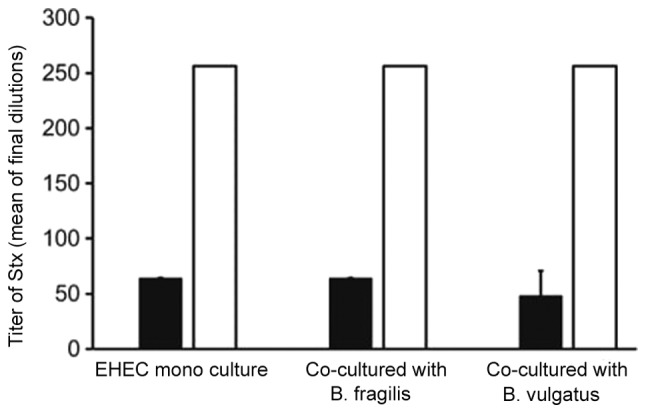
Quantification of Stx1 (black bar) and Stx2 (white bar) levels in the EHEC mono-colonized and EHEC co-cultured with Bacteroides strains groups (n=3). Data are shown as mean ± standard deviation of three different experiments. The Tukey-Kramer test revealed no statistically significant differences. EHEC, enterohemorrhagic Escherichia coli.