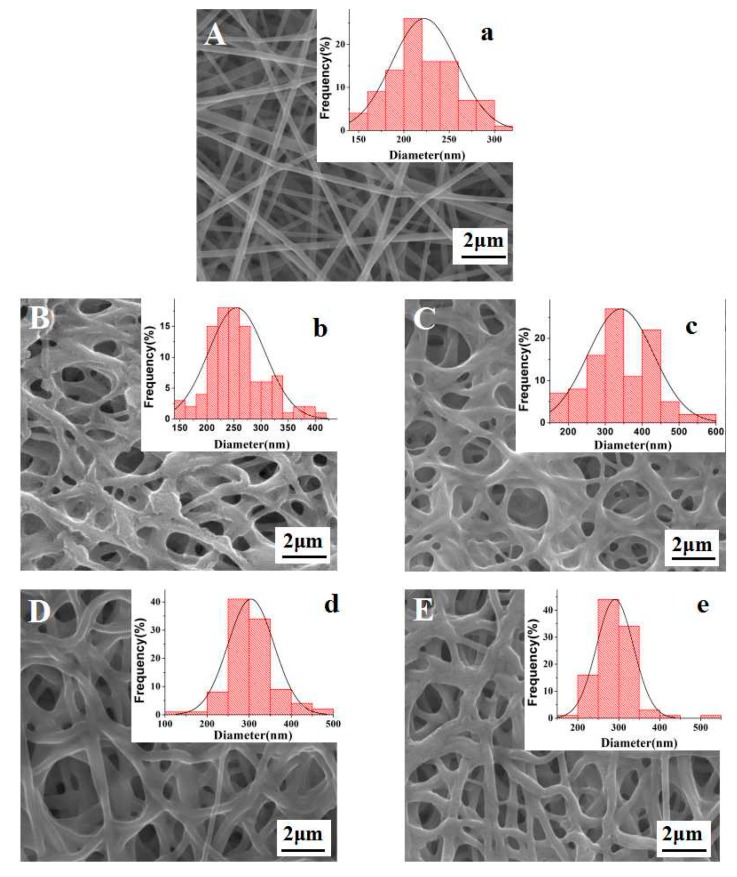
Figure 1.
SEM images and diameter distributions of FK/PVA/PEO nanofiber membranes: (A) without treatment; (B) 3h-C; (C) 12h-C; (D) 3h-G; and (E) 12h-G. The insets show the diameter-distribution of corresponding samples (for example, 3h-C refers to the FK/PVA/PEO nanofiber membranes crosslinked by citric acid vapor for 3 h. C and G are the English initials abbreviation of citric acid and glyoxal, respectively; 3 h is the crosslinking time).

