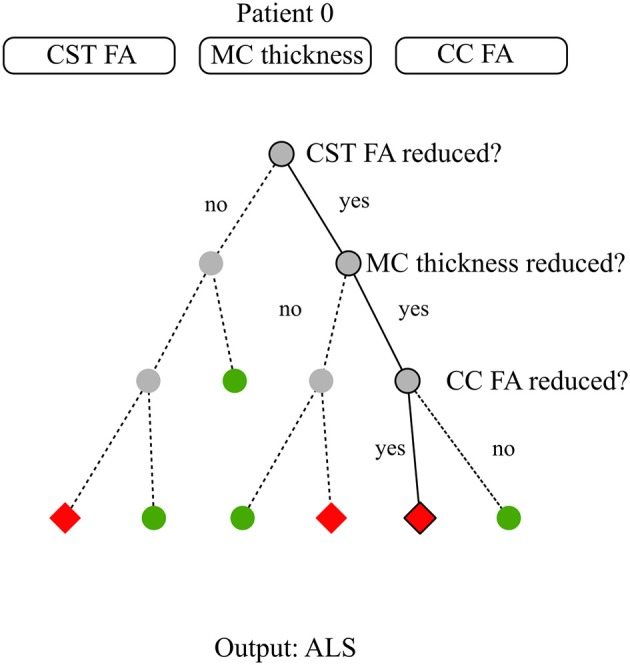
Figure 3.

Decision tree model for diagnosis. The available data consist of three basic neuroimaging features: average Corticospinal Tract (CST) Fractional Anisotropy (FA), Motor Cortex (MC) thickness, and average Corpus Callosum (CC) FA. For patient 0, these features are reduced CST FA, reduced MC thickness, reduced CC FA. The target is to classify subjects between healthy and ALS subjects. Establishing a diagnosis requires to run through the decision tree till there are no more questions to answer. At step 1, the closed question directs to the right node due to patient 0's CST pathology. At step 2, the closed question directs to the right node due to patient 0's MC pathology. At step 3, the closed question directs to the left node due to patient 0 CC involvement. Step 3 is the last step as there is no more steps below. The diagnosis for patient 0 is the arrival cell value which is ALS.
