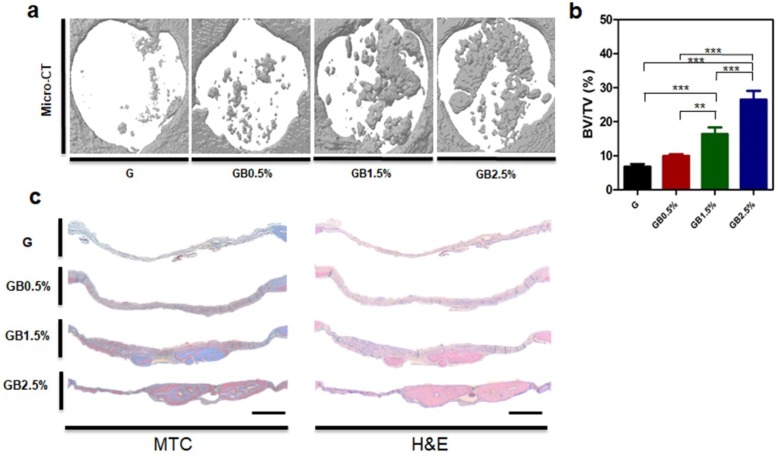
Figure 9.
In vivo experiment. (a) microCT images of cranial defect (defect diameter = 4 mm) and (b) normalized bone volume/ total volume (BV/TV) of defect after eight weeks of transplantation; error bars indicate SD (n = 3). (c) Histological analysis of Masson Trichrome and H&E staining; scale bar = 500 μm.

