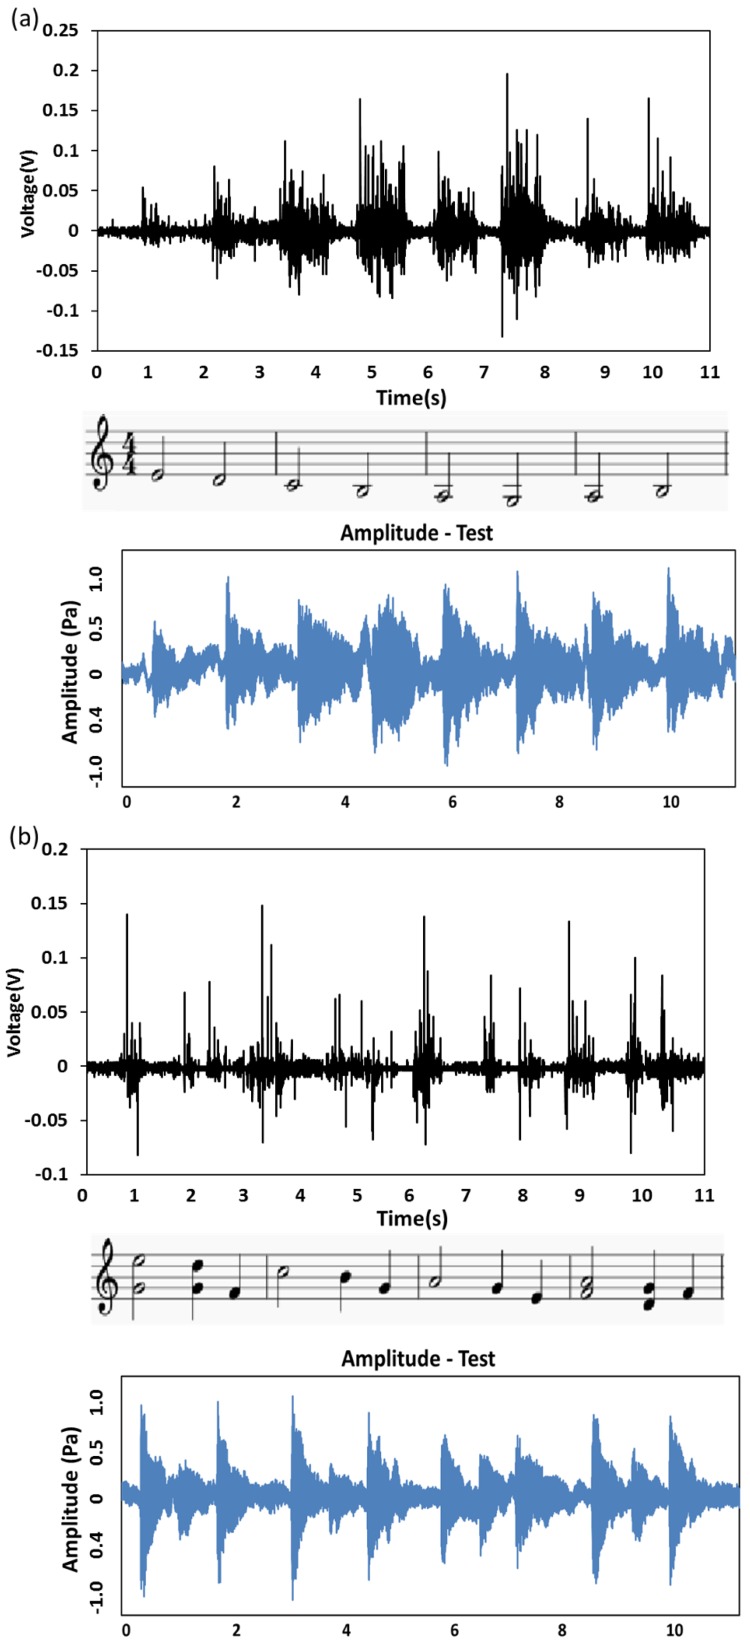
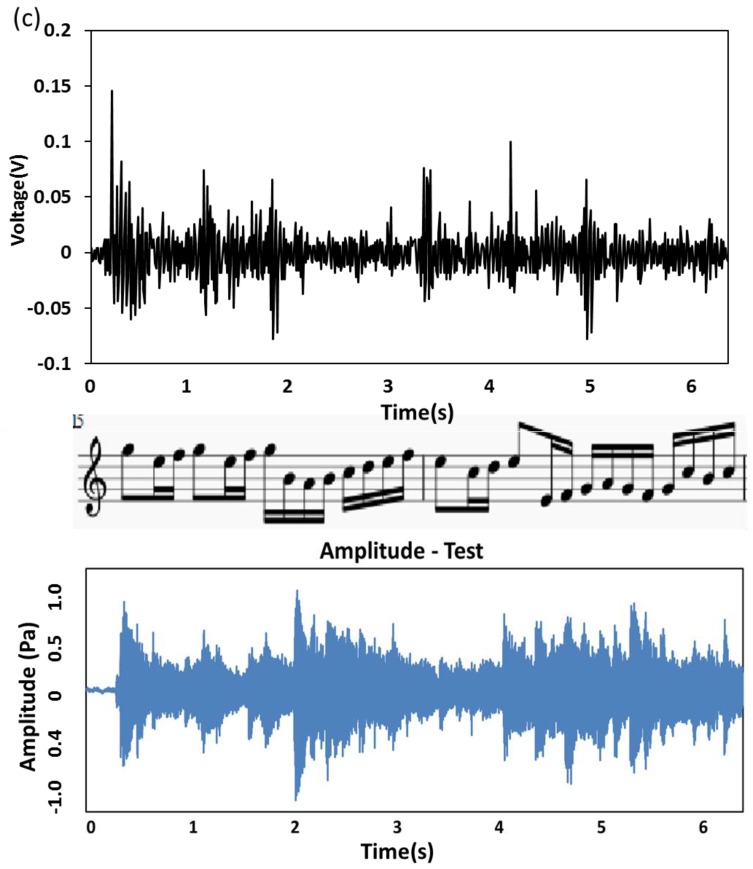
Figure 5.
The ISSE showing the capability of voice recognition. The ISSE is placed on the top of the loudspeaker and recorded responses towards different scores of Canon-in-D (a) 1–4 measures of Canon-in-D (b) 9–12 measures of Canon-in-D (c) 29 and 30 measures of Canon-in-D. The black image in the upper row indicates the voltage output responses towards different parts of Canon-in-D as measured by ISSE in a self-powered manner and the staff notation in the middle row is corresponding to the three scores of Canon-in-D. The blue image in the bottom row indicates the amplitude profiles of the original audios as measured from a complete acoustic acquisition system and microphone. Relative voltage output as measured by ISSE corresponds to nearly synchronous response to the meter-measured profiles of the original audios.


