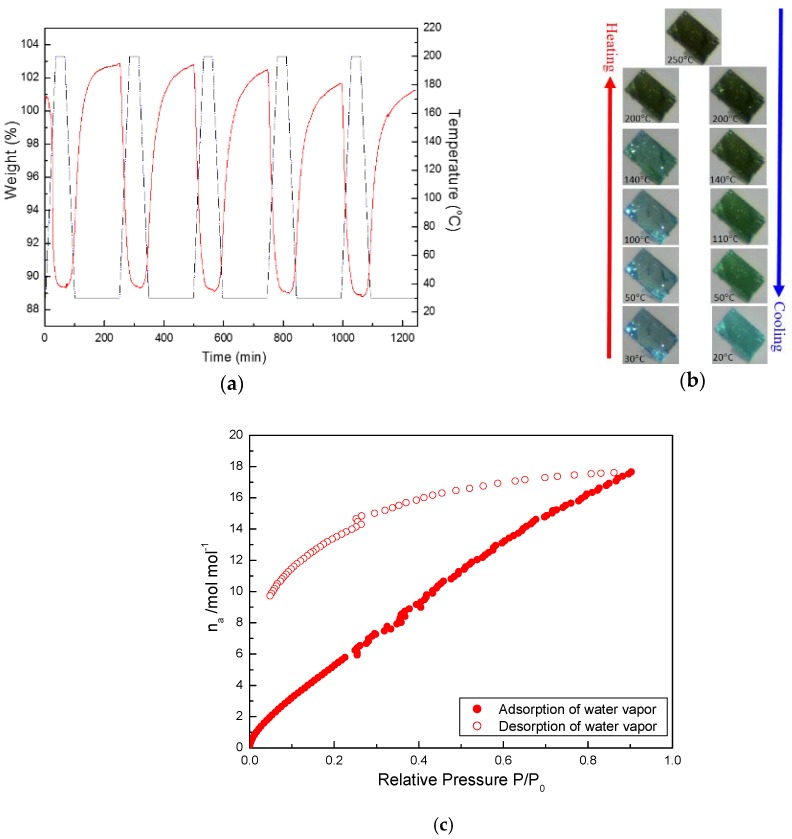
Figure 4.
(a) TG measurements of cyclic de-/re-hydration processes for 1 were repeated four times. Solid red line: the variation of weight loss with time; black dash-dot line: the variation of temperature with time. (b) Photographs of plate-shaped crystal 1 at different temperatures. (c) Water Vapor ad-/de-sorption isotherms at 298 K for 1.

