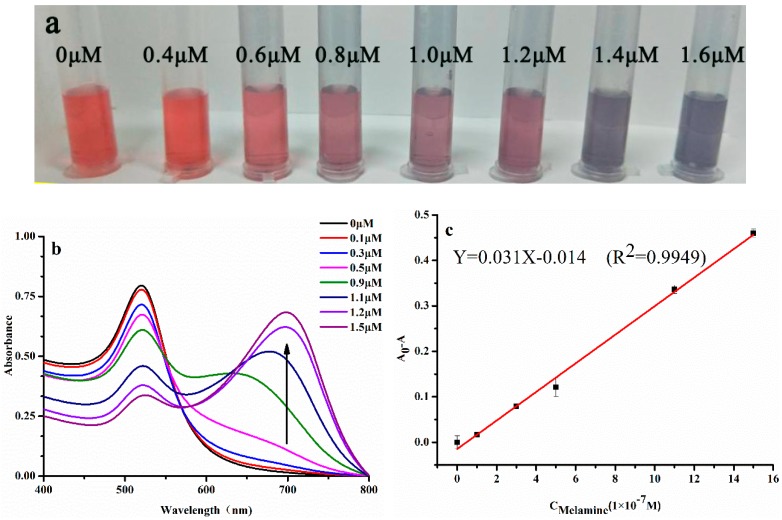
Figure 3.
(a) The visual color change of the AuNPs with different concentrations of melamine; they were marked on the tubes; (b) absorption spectra of CPNs-AuNPs with different concentrations of melamine. AuNPs: 2.37 nM; (c) a linear relationship (at 522 nm) between A0–A and melamine concentrations; A0 and A are the absorbance in the absence and presence of melamine, respectively.

