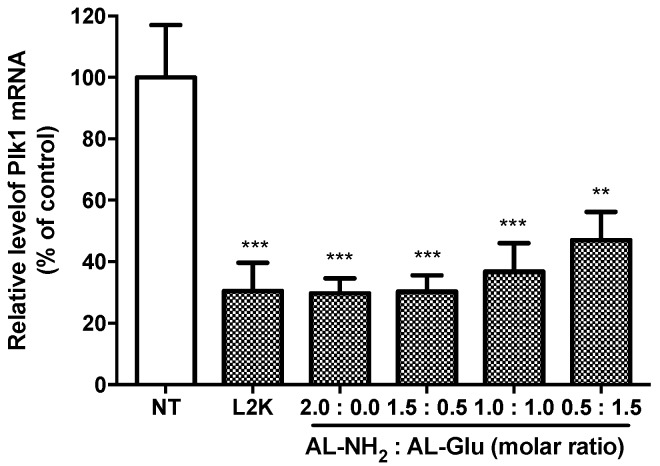
Figure 8.
Quantification of siRNA delivery efficiency of the synergistic dendrimers. HepG2 cells were treated with siPlk1 complexed to the dendrimers. After 24 h, total RNA was isolated from the cells and the mRNA level of Plk1 was quantified by RT-qPCR. Each value represents the mean ± SD (n = 4). The symbol “*” indicates significant different (p < 0.05) compared to non-treated (NT). *: p < 0.05, **: p < 0.01, ***: p < 0.005 and ****: p < 0.001 compared with NT group.

