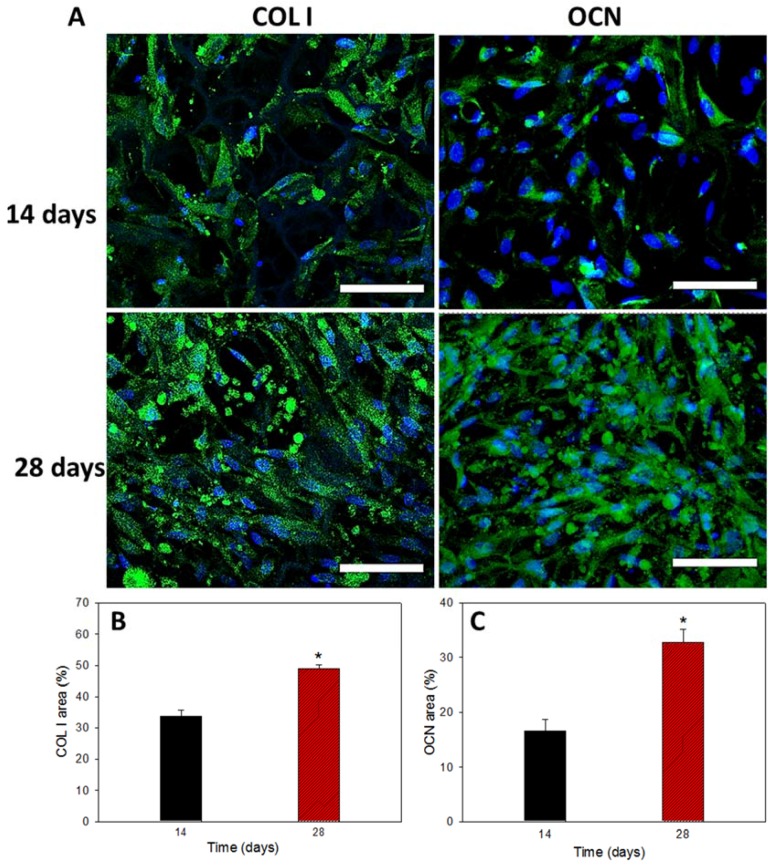
Figure 12.
Immunofluorescent staining images using DAPI for cell nucleus and FITC-conjugated antibody for type I collagen (COL I) and osteocalcin (OCN) (A) (bar = 300 μm). The semi-quantitative analysis of COL I (B) and OCN (C) were obtained by analysis with PAX-it!TM software. * p < 0.05 compared to day 14. Bar = 75 μm.

