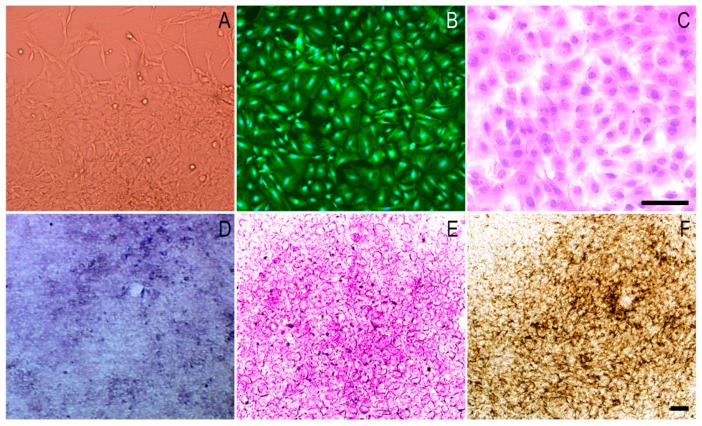
Figure 5.
Phase contrast microscopy images of the morphology and differentiation of MC3T3-E1 cells. (A): cell morphology of MC3T3-E1cells; (B): Calcein-AM staining of the seventh generation of cells; (C): Hematoxylin-eosin (HE) staining of the seventh generation of cells; (D): Alkaline phosphatase staining after one week of osteogenic induction; (E): Alizarin red S staining after three weeks of osteogenic induction; (F): Von-Kossa staining after four weeks of osteogenic induction. Scale: 250 μm.

