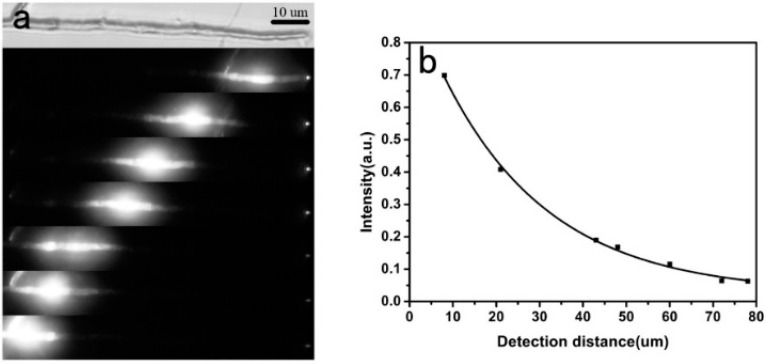
Figure 5.
(a) Fluorescence microscopy images collected upon different excitation positions of the same microtube. (b) Itip/Ibody versus propagation distance and the exponential fit (Itip and Ibody are shorted for the fluorescence intensity from the tip and the body of the microtube, respectively, the whole Figure 5 was reprinted with permission from Hu et al. [43]).

