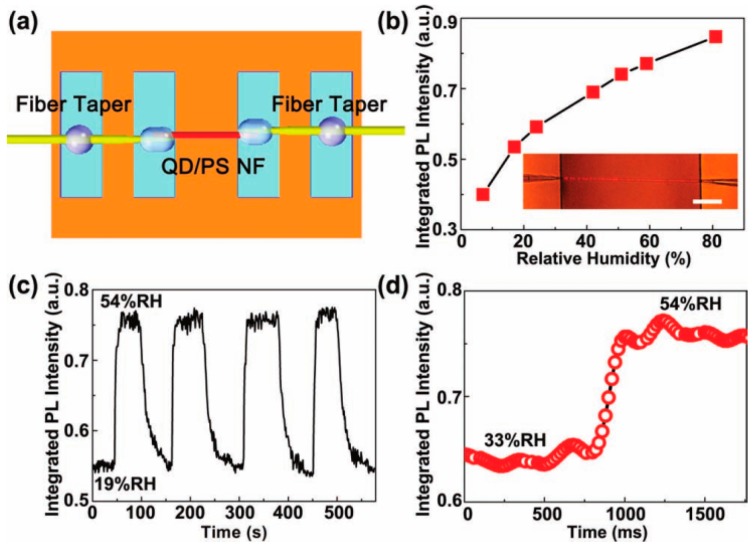
Figure 17.
Quantum dot (QD)/polystyrene (PS) single-nanofiber humidity sensor. (a) Schematic diagram. (b) Integrated PL intensity of the polymer nanofiber exposed to relative humidity (RH) from 7% to 81%. Inset: microscopy image of the polymer nanofiber upon light excitation used in the sensor. (c) Response of the nanofiber sensor to alternately changed relative humidity of air from 54% to 19%. (d) Time-dependent integrated PL intensity of the nanofiber when relative humidity jumped from 33% to 54% (NF in the figure referred to the nanofiber, the whole Figure 17 was reprinted with permission from Meng et al. [42]).

