-
A
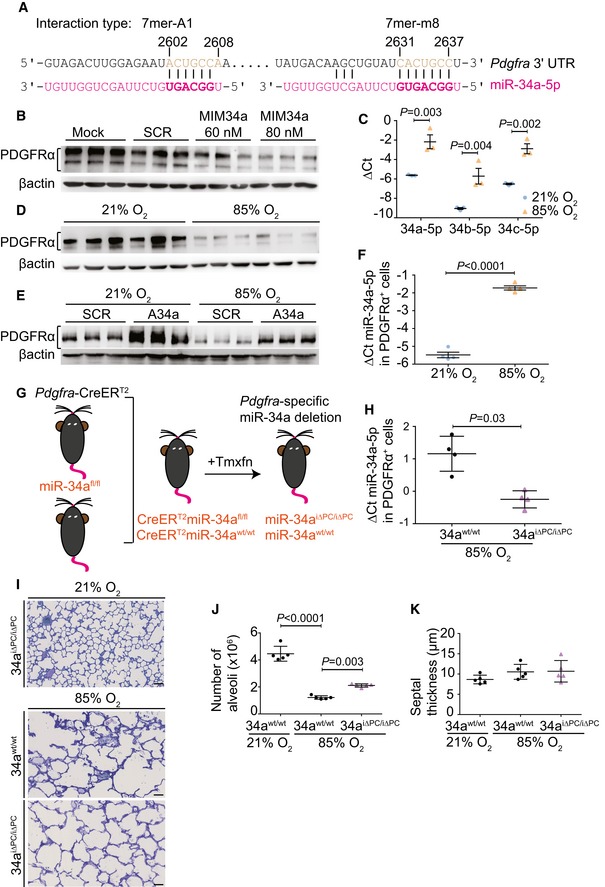
In silico identification of miR‐34a binding sites in the Pdgfra 3′‐UTR.
-
B
Immunoblot detection of PDGFRα levels in MLg cells after treatment with scrambled microRNA (SCR) or a miR‐34a (MIM34a) mimic (n = 3 separate cell cultures for each group).
-
C
Quantitative RT–PCR detection of miR‐34a/b/c‐5p levels in MLg cells in vitro, maintained under 21% O2 or 85% O2 (n = 3 separate cell cultures for each group).
-
D
Immunoblot detection of PDGFRα levels in the lungs of mouse pups (n = 6 animals for each group) at post‐natal day (P)5, during normal (21% O2) and aberrant (85% O2) alveolarization.
-
E
Immunoblot detection of PDGFRα levels in MLg cells in vitro, maintained under 21% O2 or 85% O2, where cells had been transfected wither with a scrambled (SCR) antimiR, or an antimiR directed against miR‐34a (A34a) (n = 3 separate cell cultures for each group).
-
F
Quantitative RT–PCR detection of miR‐34a‐5p levels in PDGFRα
+ cells, sorted by FACS from the lungs of mouse pups (
n = 4 animals for each group; data from an independent repetition are provided in
Appendix Fig S5) at P5, maintained under 21% O
2 or 85% O
2 from birth.
-
G
Schematic illustration of the generation of a conditional, inducible deletion‐ready mouse strain, where administration of tamoxifen (Tmxfn) abrogated miR‐34a expression in Pdgfra‐expressing cells (denoted miR‐34aiΔPC/iΔPC).
-
H
Quantitative RT–PCR detection of miR‐34a‐5p levels in PDGFRα+ cells, sorted by FACS from the lungs of either wild‐type (34awt/wt) mouse pups, or mouse pups in which miR‐34a expression in Pdgfra‐expressing cells (34aiΔPC/iΔPC) at P5 (n = 4 animals for each group).
-
I
Qualitative analysis of lung structure in Richardson‐stained plastic‐embedded lung sections from 34awt/wt or 34aiΔPC/iΔPC mouse pups at P14 during aberrant (85% O2) alveolarization, compared with 34aiΔPC/iΔPC during normal (21% O2) alveolarization (scale bar, 50 μm). Data are representative of observations made in four other experiments.
-
J
Quantification of total number of alveoli by design‐based stereology in 34awt/wt or 34aiΔPC/iΔPC mouse pups at P14, during normal and aberrant alveolarization (n = 5 animals for each group).
-
K
Quantification of mean septal thickness by design‐based stereology in 34awt/wt or 34aiΔPC/iΔPC mouse pups at P14, during normal and aberrant alveolarization (n = 5 animals for each group).
Data information: For immunoblots (B, D, E), protein loading equivalence was controlled by βactin levels. (C, F, H, J, K) Data represent mean ± SD. In (C, F, and H),
P values for pair‐wise comparisons were calculated by unpaired Student's
t‐test. In (J and K),
P values for selected comparisons were calculated by one‐way ANOVA with Tukey's
post hoc modification.
Source data are available online for this figure.

