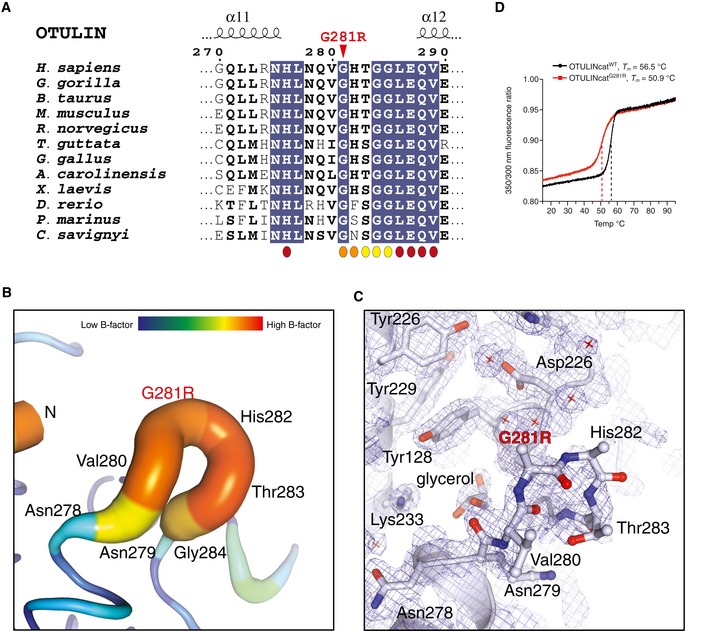
Figure EV1. Structural analysis of OTULING 281R (related to Fig 2).

-
AMultiple sequence alignment of the sequence surrounding Gly281 in OTULIN's catalytic domain. The Gly281Arg mutation is indicated by a red arrowhead. Residues interacting with the proximal (orange), distal (maroon) or both Ub (yellow) moieties are indicated.
-
BPutty representation of the α11‐α12 loop incorporating the Gly281Arg mutation from the OTULING281R structure (PDB: 6I9C). An increased radius of the cartoon and increase in colours yellow‐red represent increased crystallographic temperature, B factors, and reflect the increased disorder of the α11‐α12 loop relative to the rest of the structure (comparable B factors are only found at the N and C termini where there is no secondary structure).
-
CElectron density for the same region as in (B). A weighted 2Fo‐Fc map is shown contoured at 1σ. Residues from the α11‐α12 loop are shown as stick representation. Owing to the increased motility of the α11‐α12 loop, no interpretable electron density was observed for the side chains of Gly218Arg and His282 and only the Cα and backbone amide could be confidently fitted into the electron density map. Other residues in the region had interpretable electron density and several water molecules in the region were sufficiently ordered to be modelled (red cross).
-
DTryptophan fluorescence upon thermal unfolding of OTULINcatWT and OTULINcatG281R (1.0 mg/mL) measured by nanodifferential scanning fluorimetry (nano‐DSF). Apparent melting temperatures (T m) are indicated (dashed lines). Data are representative to two independent experiments.
