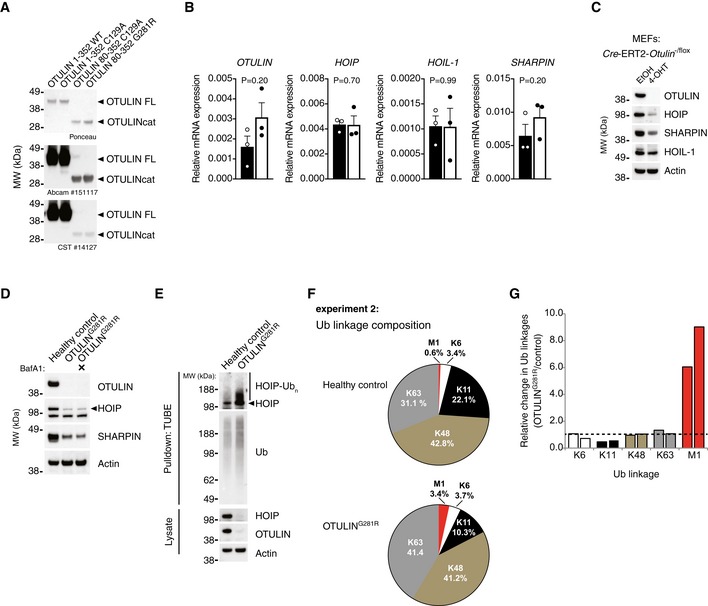
Figure EV2. Analysis of protein and mRNA expression in OTULING 281R and quantitative proteomics analysis of the cellular Ub linkage composition (related to Fig 3).

-
AAnalysis of antibody recognition of recombinant OTULIN proteins. 200 ng recombinant protein was loaded in each lane. Membranes were stained with Ponceau S before immunoblot analysis was performed with the two anti‐OTULIN antibodies used in this study (#14127 from Cell Signaling Technology and ab151117 from Abcam). Data are representative of two independent experiments.
-
BRelative mRNA levels of OTULIN, HOIP, HOIL‐1 and SHARPIN from primary healthy control and patient fibroblasts measured by quantitative RT–PCR. Bars represent mean ± SEM of three independent experiments each performed in duplicate. Statistical significance was determined using the Mann–Whitney U‐test.
-
CImmunoblot analysis of whole‐cell lysates from Cre‐ERT2‐Otulin −/flox inducible knock‐out MEFs treated with 4‐hydroxytamoxifen (4‐OHT) (100 nM) or ethanol (EtOH) alone as indicated. Data are representative of two independent experiments.
-
DImmunoblot analysis whole‐cell lysates from primary healthy control and patient fibroblasts either left untreated or treated with the autophagosome inhibitor bafilomycin A1 (BafA) (100 nM) for 24 h. Data are representative of two independent experiments.
-
EImmunoblot analysis of endogenous Ub conjugates purified by TUBE pull‐down from untreated healthy control and patient fibroblasts shows HOIP ubiquitination in the patient cells. Data are representative of two independent experiments.
-
FBiological replicate of the experiment shown in Fig 3D. AQUA‐MS/MS data from TUBE‐based purification of cellular polyUb conjugates from untreated primary fibroblasts from a healthy control or patient III.2 harbouring the OTULING281R mutation. K27, K29, linkages could not be detected and K33 could not be accurately quantified in all samples.
- G
Source data are available online for this figure.
