
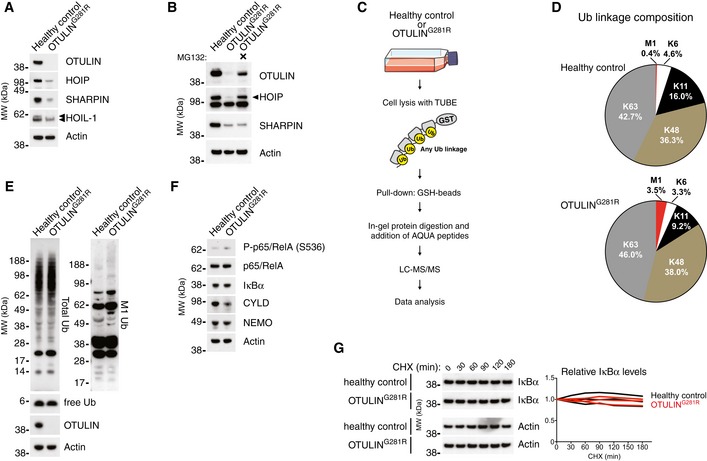
Figure 3. LUBAC degradation and accumulation of M1‐linked Ub in OTULING 281R fibroblasts.
-
AImmunoblot analysis of whole‐cell lysates from untreated primary healthy control and patient fibroblasts. Data are representative of three independent experiments.
-
BImmunoblot analysis of whole‐cell lysates from primary healthy control and patient fibroblasts either left untreated or treated with the proteasome inhibitor MG132 (10 μM) for 24 h. Data are representative of two independent experiments.
-
CSchematic representation of the AQUA‐MS/MS‐based proteomics approach for quantification of cellular Ub linkage composition.
-
DAQUA‐MS/MS data from TUBE‐based purification of cellular polyUb conjugates from untreated primary fibroblasts from a healthy control or patient III.2 harbouring the OTULING281R mutation. K27, K29, linkages could not be detected, and K33 could not be accurately quantified in all samples. Data are representative of two independent experiments (see Fig EV2F and G).
-
E, FImmunoblot analysis of whole‐cell lysates from untreated primary healthy control or patient fibroblasts. Data are representative of three independent experiments.
-
GImmunoblot (left) and densitometry (right) analysis of IκBα levels in primary healthy control and patient fibroblasts treated with cycloheximide (CHX) (50 μg/ml) as indicated. Data are representative of three independent experiments.
Source data are available online for this figure.