
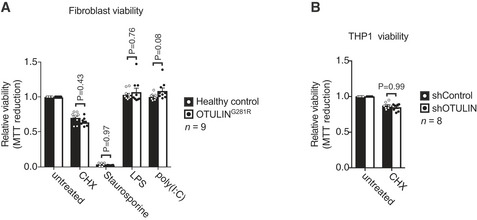
Figure EV3. Analysis of viability of healthy control or OTULING 281R primary fibroblasts and shControl or shOTULIN THP‐1 cells (related to Fig 6).
-
AViability of healthy control or OTULING281R primary fibroblasts after 24 h of treatment with CHX (50 μg/ml), staurosporine (1 μM), LPS (100 ng/ml) or poly(I:C) (1 μg/ml) as indicated was analysed using MTT reduction assays. Results were normalised to untreated samples. Each experiment was performed in duplicate. Bars represent mean ± SEM (n = 9) and were analysed using the two‐way ANOVA test of statistical significance with Sidak's correction for multiple comparisons.
-
BViability of healthy control or shControl and shOTULIN THP‐1 cells after 6 h of combination treatment with TNF (100 ng/ml) and CHX (50 μg/mL) as indicated was analysed using MTT reduction assays. Results were normalised to untreated samples. Each experiment was performed in duplicate. Bars represent mean ± SEM (n = 8) and were analysed using the two‐way ANOVA test of statistical significance with Sidak's correction for multiple comparisons.