
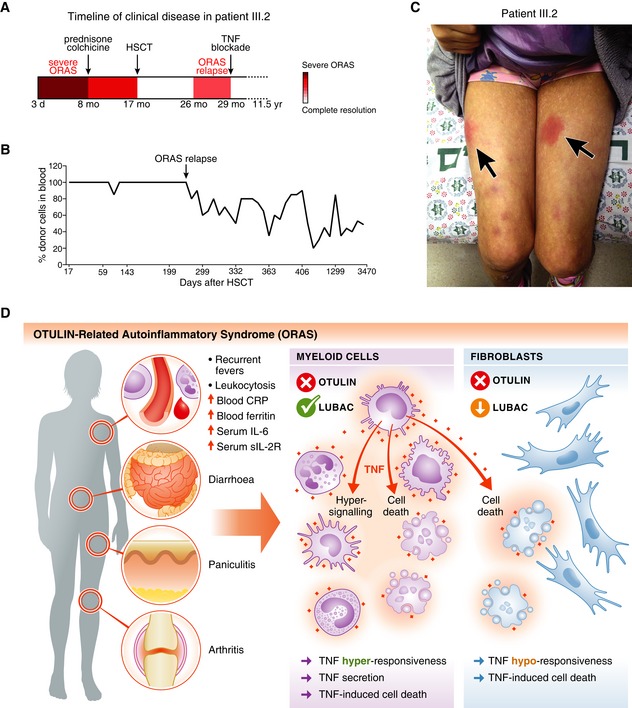
Figure 7. HSCT ameliorates clinical ORAS symptoms in patient III.2.
-
ASchematic of the timeline of clinical disease in patient III.2 (see Appendix Clinical Description). Arrows indicate therapeutic interventions. d, day; mo, month; yr, year.
-
BAnalysis of the blood cell chimerism in patient III.2 after HSCT. Short terminal repeat (STR) analysis was used to determine the percentage of donor cells in peripheral blood. Arrow indicates point of relapse.
-
CPhotograph of patient III.2 at age ˜10 years at an episode of inflammation caused by delayed etanercept administration. Arrows indicate the erythematous subcutaneous nodules (panniculitis).
-
DModel of the cellular effects of OTULIN deficiency in myeloid cells and fibroblasts in ORAS. Hyper‐signalling and TNF secretion in myeloid cells as well as TNF‐induced cell death of both haematopoietic cells and cell types with LUBAC downregulation, e.g. dermal fibroblasts, may contribute to the inflammation, pathogenesis and clinical manifestation of ORAS.