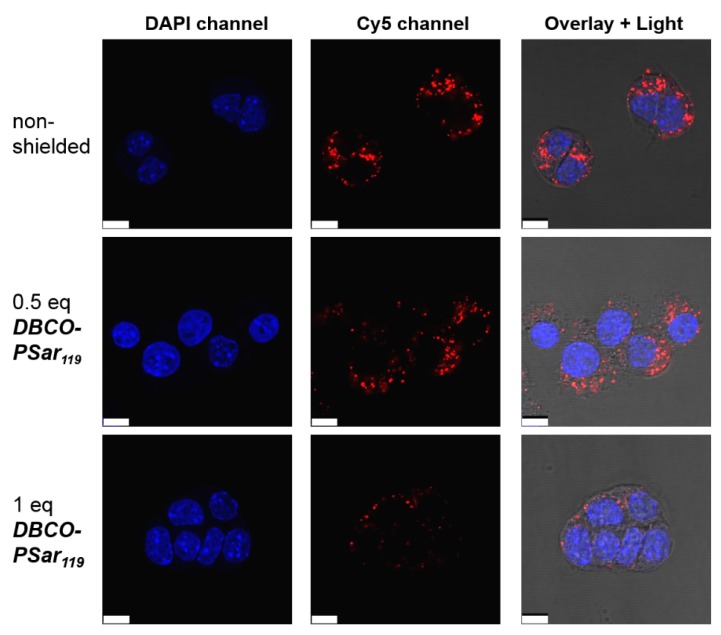
Figure 3.
Intracellular distribution of T-1N3 siRNA formulations in Neuro2a-eGFP-Luc cells with increasing equivalents (eq mol/mol) of DBCO-pSar119 acquired with a confocal laser scanning microscop. Cells were incubated with the formulations for 4 h and washed with PBS buffer. siRNA was spiked with 20% Cy5-labeled siRNA (red), nuclei were stained with DAPI (blue). The overlay image shows the light microscope image and the merged DAPI and Cy5 channels. Scale bar: 10 µm.

