. 2018 Dec 3;8(2):206–215. doi: 10.1039/c8tx00192h

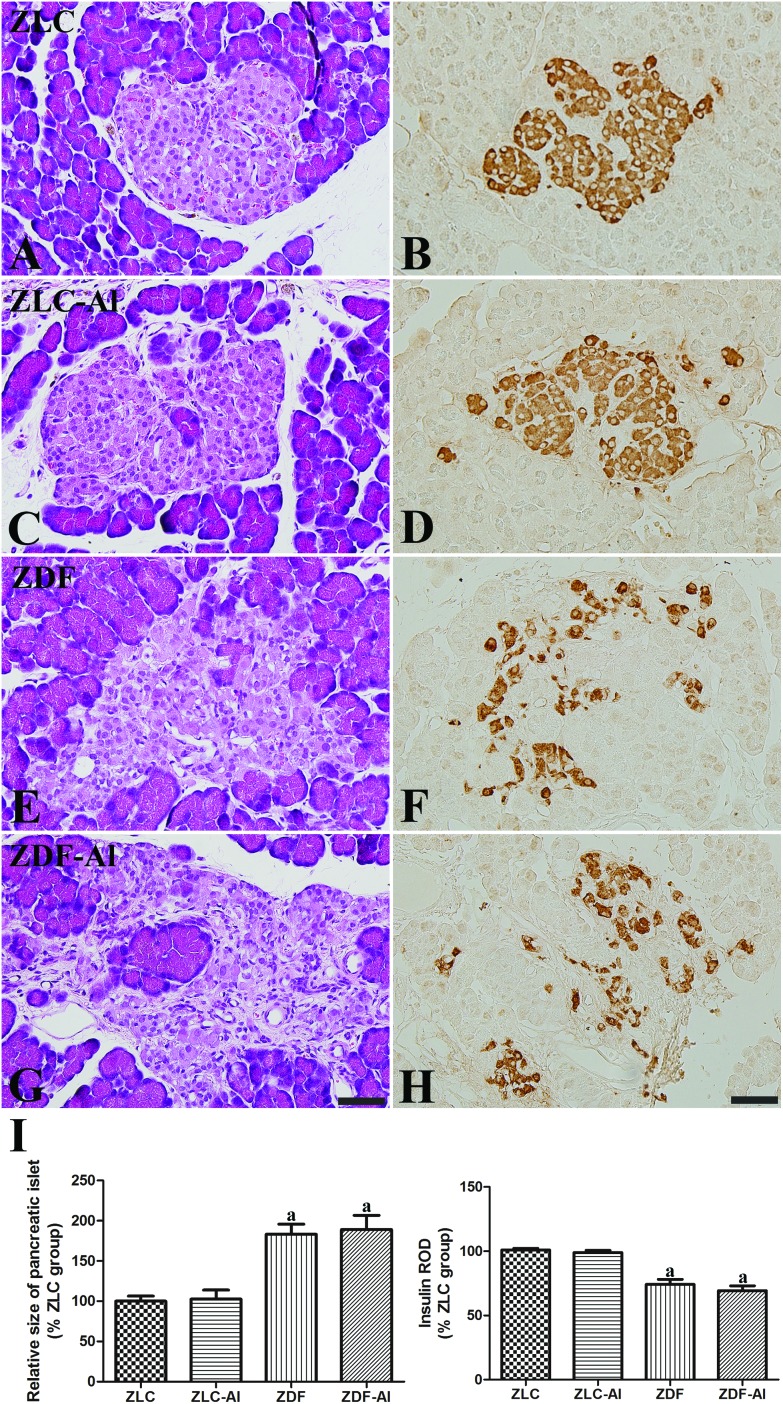
Fig. 2. Hematoxylin and eosin staining (A, C, E and G) and immunohistochemistry for insulin (B, D, F and H) in the pancreatic islets in the ZLC (A and B), ZLC–Al (C and D), ZDF (E and F), and ZDF–Al (G and H) rats. Scale bar = 50 μm. The relative size of the pancreatic islets and insulin immunoreactivity are expressed as percentages of the respective values in the ZLC group (I). Note that the islets are significantly enlarged in ZDF and ZDF–Al groups and insulin immunoreactive β cells are decreased in the ZDF and ZDF–Al rats. However, no histological and immunohistological differences are found between non-Al and Al groups (n = 5 per group; aP < 0.05 indicates a significant difference between ZLC and ZDF or ZLC–Al and ZDF–Al groups, bP < 0.05 indicates a significant difference between ZLC and ZLC–Al or ZDF and ZDF–Al groups). Error bars indicate the SEM.

Fig. 2